Market Update Q4 2025
10th October 2025
Market snapshot: Q4 2025
Markets resilient on the surface, pressure below
Global equities are buoyant, with industrials lifted by defence and infrastructure demand. Financials gain from credit quality, revived deal‑making, and investments into private markets. Gold outpaced major indices. Mega-cap AI techs continue to drive gains in the S&P 500, but other sectors are strengthening.

Movements relative to previous update.
* Returns above are calculated from the GBP total return index of each index, for respective dates between 01/01/2025 and 30/09/2025; ** deflation
Macroeconomic outlook: growth decelerates but a full contraction is not expected
Leading indicators continue to point to subdued growth across major economies
- Interest rates were held by the Bank of England, European Central Bank and Bank of China last quarter, while the Federal Reserve delivered a long‑anticipated cut. Another US cut is priced in; UK forecasts remain split, amid inflation and fiscal strain, and China and Europe are expected to hold.
- Inflation – U.S. services inflation stays high on domestic costs, keeping the Fed wary. UK inflation is sticky and appears to be persistent, with wage and tax pressures adding strain. EU inflation is on target, but expectations are rising. China’s deflation may be bottoming, though weak labour risks recovery. Globally, tariffs and oil shocks keep cost‑push risks alive.
- Employment – Youth unemployment is a structural weak spot in major economies. Rising downside risks persist in the US despite a low headline unemployment rate. UK joblessness is climbing in manufacturing and retail; labour market resilience is eroding under inflation and cost of living strains. Weak growth makes Euro‑area unemployment vulnerable, and China’s mounting labour stress is likely understated.
UK markets
UK markets remain steady, led by large-cap Energy, Materials, and Financials, while domestic sectors face headwinds from soft growth and the need to close the fiscal gap—a key factor for business and consumer confidence. Sterling reflects underlying fundamentals. Cybersecurity stays in focus after recent high-profile incidents, with strong reporting standards offsetting public-sector staffing gaps. Higher tax revenue is likely to be needed to stabilise public finances, keeping investor attention on value and dividend resilience over domestic growth.
Outlook – U.S. policy direction, fuel as a conflict lever, and AI deployment
- Ripples From Washington – The U.S. government shutdown adds a fresh uncertainty to global markets, though it much depends on how long it lasts. Short disruptions are typically shrugged off; prolonged fiscal standoffs add to broader concerns over U.S. fiscal sustainability, and political stability, all of which could gradually erode confidence in the dollar’s reserve-currency standing.
- Ukraine fuel targets – Ukraine’s strikes on Russian energy hubs echo WWII tactics of crippling an aggressor’s industrial base— pressure that could hasten Russian fatigue and the war’s end. Post-conflict rebuilding will generate a peace dividend, redirecting capital from wartime destruction to energy, construction, agriculture, materials, defence, and economic growth.
- AI productivity boost – So far, returns have centred on Big Tech and chipmakers, but as with the PC and internet booms of the 1990s, the real gains depend on diffusion — how fast AI spreads across sectors. As adoption deepens, productivity and returns will increasingly come from firms using AI, not just those building it.
Geopolitical snapshot: Early signs of Russia burning out
Recent developments:
The slow-moving frontline of Russian forces into the Donbass region of Ukraine is often the focus of headlines, but we would flag two developments, domestic fuel supply, and tank reserves which indicate that beneath the headlines Russia is under significant strain.
Fuel: The War’s Hidden Frontline
Ukraine’s heavy battlefield losses have compelled a strategic pivot toward striking the industrial heart of Russia itself. Over the past year, Ukraine’s long-range drone and missile campaigns have grown markedly more effective, disabling nearly 40 percent of Russia’s oil-refining capacity and reducing domestic fuel output by 10–20 percent. The resulting shortages have forced rationing in several regions and strained Moscow’s logistics chain. Historic parallels with Germany’s wartime fuel collapse in 1944 suggest that this sustained focus on energy infrastructure could critically weaken Russia’s war economy—potentially bringing the Kremlin to the negotiating table not through exhaustion at the front, but through paralysis in its rear.

Armour: Depletion and Decline

Open-source intelligence provides a consistent assessment of Russia’s shrinking pool of operational tanks. What remains in storage—approximately 2,500 vintage units—requires extensive and costly refurbishment before being combat-ready. Despite an aggressive refurbishment program, Russia will struggle to sustain its mechanized assault strength of roughly 2,000 deployed tanks beyond the next 12 months.
Sources:
https://www.oryxspioenkop.com/2022/02/attack-on-europe-documenting-equipment.html
Stored equipment by @jonpy99, @highmarsed, @waffentraeger, @CovertCabal,
@Vishun_military, @Ath3neN0ctu4
- Pyongyang and Tehran are also drawing down their ammunition reserves to fuel Russia’s demand. Currently they have less material for their own deterrence and are at greater vulnerability to supply-chain collapse. Tehran for example has fewer resources to pursue operations against Israel.
- Russia can likely sustain high-tempo operations through 2026, backed by war spending of 6–8 percent of GDP and foreign ammo inflows from North Korea and Iran.
- Ukraine’s emerging Flamingo cruise missiles and long-range drones are hollowing out Russia’s industrial and energy base. Repeated hits puts industrial machinery beyond repair—which is creating a slow-motion logistical collapse in Russia.
Conclusion
Russia may endure another year of war—but not another year of attrition at this intensity.
The market odds of a ceasefire in 2026 have reduced to 42%, but it is increasingly hard to see how the war can be sustained throughout 2027. We would expect a peace dividend to support global economic growth and increased economic optimism at that time horizon.
Gold: Primer on the recent surge in Gold prices

Sources: LSEG, World Gold Council & IMF
Where is the gold?
The World Gold Council gives global above-ground gold stock distributed roughly as: ≈ 45% in jewellery, ≈ 22% in bars/coins (including investment & ETFs), ≈ 17% held by central banks, and ≈ 15% in “other” (industrial, technology, etc.). With the Bank of England storing the most gold for institutions in central London.

Who is driving the price rises?
- Last year jewellery demand was ~1,900 tonnes, investment demand ~1,200 tonnes, and central bank net purchases ~1,000 tonnes, with industrial/tech (technology) demand ~330 tonnes. So, in flow-terms, jewellery is a large slice, but central banks and investors are substantial.
- Central banks have in recent years shifted into net buyers, especially in emerging/developing markets, seeking to reduce reliance on fiat or dollar assets and diversify reserves. In 2024, central banks bought over 1,000 tonnes, making them one of the largest single sources of demand.
- Countries like Poland, India, and Kazakhstan have been active in expanding their reserves — Poland is often cited for large incremental purchases over 2025 supported by a fast-growing economy which is on track to overtake the UK’s GDP over the coming decade.
- On the investor side, ETFs and physical investment (bars/coins/OTC) have regained strength: ETF inflows especially out of North America have led the recent price activity, driving much of the incremental investment demand. Investors turn to gold as a hedge in inflationary or uncertain regimes, often reacting faster to market signals than central banks. Uncertainty around the potential for pull backs from AI exposure may also be influencing demand.
- Jewellery demand is sensitive to consumer income and the gold price; its share shrinks when gold gets very expensive. So, the indications are that Jewellery demand may weaken at current gold prices.
Conclusion
- The US ETF market is very fickle, so the volatility of Gold could increase substantially, particularly if Jewellery demand slumps due to high prices.
- Price rises in Gold is consistent with falling interest rates and this stage of the economic cycle- but a small chance of inflation shocks from tariff import inflation could lead to surprise increases in US interest rates, and a sharp capital flows out of gold.
AI: Warnings have been sounded on AI valuations
AI overview
- In September 2020 we presented our first comment on AI, that we thought it was likely that a bubble would form in the AI Sector. Five years, on and it’s harder to call because AI firms are posting real growth to present a credible basis for a future sustainable business model. For example, OpenAI’s annualised revenue has reportedly leapt to about £13bn, up from roughly $5.5bn a year ago, according to Reuters, as generative tools seep into everyday work—from coding and correspondence to robotics and design. The costs are just as startling: the Financial Times tallies $1trn-plus of multi-year compute and power commitments across Nvidia, AMD, Oracle, CoreWeave and others—orders of magnitude above today’s revenues, so there are clearly risks.
- At the technological frontier, what matters is “frontier training compute”: the total number-crunching needed to train the single most advanced model at any moment. Analysts track it because it shows how fast the AI bar is rising—lately, roughly doubling every few months. Nvidia remains the default platform for these technological feats, thanks to chips, interconnects and software that arrive as a turnkey stack. Witness xAI: its “Colossus” supercomputer that was assembled in 122 days; training began 19 days after the first racks landed; and then the system doubled in 92 days to roughly 200,000 GPUs.
- Power is the new scarce input. The International Energy Agency thinks global data-centre electricity use will roughly double by 2030 (about 15% a year), with AI-optimised centres rising more than fourfold; DNV, a Norwegian consultancy, sketches a more aggressive tenfold increase in AI-driven demand. That hints at awkward trade-offs if data centres start competing with households and industry for energy.
- Investors have seen this before. Arm, a Cambridge spin-out, floated in 1998 at a then-eye-popping £1bn on revenues of £43m and profits of £5.4m; it is now worth about £164bn on roughly £4bn of sales, and its value historically drops dramatically on any hints of slowing growth. It took a hit during the tech bubble burst of 2001-2003 but recovered over the following years. In the late 1990s and early 2000’s the notion of an Arm chip in every home seemed fanciful; but today most homes contain hundreds of embedded ARM chips in assorted gadgets. The message is that compounding growth is hard to visualise—until it’s everywhere. We note that in September 2025 Arm unveiled new AI cores to run models on phones and watches without the cloud.
Are today’s AI valuations justified?

- The Industry does not have much visibility over the next five years. A close look at NVIDIA revenue projections from market participants shows that all forecasts are exponential, growing, but small changes in assumptions lead to vastly different future revenue projections.
- A credible, if execution-heavy, route to sustainability does exist: partner-funded mega-projects that keep capex off balance-sheet; falling cost-per-FLOP as new silicon and smarter software arrive (with some firms pursuing custom chips); and a better take-rate over time as revenue-sharing falls. The risks are equally plain: financing and delivery of gigawatt-scale sites, the elasticity of enterprise demand, and the hazards of bespoke silicon. For now, costs are not self-funding; over the later 2020s the outcome will hinge on growth endurance, efficiency gains and deal economics.
Bubble warnings
- The Bank of England’s Financial Policy Committee warns that AI-driven stock valuations look stretched and that markets are vulnerable to a “sharp correction” if sentiment on AI sours; it also flags “material bottlenecks to AI progress” as a risk to those valuations. Governor Andrew Bailey has urged a “pragmatic and open-minded” approach—seeing promise but focusing on risks—and has argued AI need not trigger mass job losses, even as supervisors study its systemic implications.
- Industry voices are split. Sam Altman (Open AI) says parts of the sector are “kind of bubbly,” though he expects “real value” to be created—and he has repeatedly stressed that future AI will require an energy breakthrough. Jensen Huang (NVIDIA) counters that demand has risen “substantially” and is still early-stage, placing him in the “no bubble” camp. Jamie Dimon (JPMorgan Chase) cautions that a significant market pullback is plausible over the next year or two—even as he argues AI will ultimately “pay off,” with many investors unlikely to share equally in the gains. And from the supply side, Lisa Su (AMD) notes AI chip demand remains strong and supply tight through 2025, underlining how capacity and components can constrain the story.
Who is holding the debt?
- A pull back in AI, and tech more broadly, is likely to impact most on whoever is holding debt to support the AI business model. A snapshot of where leveraged exposure sits today is in these key areas:
Margin debt:
- FINRA’s aggregate customer margin balances are at ~$1.06 trillion (Aug. 2025), an all-time high—up ~33% y/y.
Leveraged tech ETFs:
- TQQQ (3× Nasdaq-100): ~$29B AUM (largest leveraged ETF).
- SOXL (3× semis): ~$11–13B AUM.
- TECL (3× tech sector): ~$4B AUM.
- Across the category, leveraged-equities ETFs total ~$122B AUM (Yahoo Finance)
Bond taps linked to AI capex:
- Oracle sold $18B of bonds in Sept. 2025 to fund AI data-center expansion (one of the year’s biggest IG deals).
Data-center REIT balance sheets (financing AI buildouts):
- Digital Realty: ~$18.5B total debt.
- Equinix: ~$21.9B total debt.
Convertible issuance (equity-linked leverage popular with tech/growth):
- 2025 has seen a five-year high in global convertibles, with ~$53B U.S. YTD by mid-year and momentum continuing into late September. (Houlihan Lokey)
Private credit to GPU clouds / hosters:
- CoreWeave closed an up to $7.5B debt facility (Blackstone, Magnetar, et al.), emblematic of private-credit leverage behind AI capacity.
Real world impacts of AI on the UK
- Headline: roughly $45bn of announced private UK AI-infrastructure capex (Microsoft $30bn 2025–28; AWS $14bn; Google $1bn) alongside ~£850m in public compute/safety funding (Edinburgh exascale ~£750m; AI Safety Institute £100m)—plus Amazon’s broader £40bn UK investment (not AI-only). Venture flows are rebounding, with $2.4bn raised by UK AI start-ups in 1H-2025 and £2.9bn invested in dedicated AI firms in the 2025 sector study.
- Regional impacts: the South West (Bristol) is anchored by Isambard-AI and growing HPC skills; the East of England (Cambridge) hosts the Dawn system and a thriving chip/software ecosystem, with a major data-centre build at Waltham Cross; Scotland (Edinburgh) is the exascale hub, catalysing grid and site upgrades; and London remains the deal-flow and late-stage capital magnet (e.g., Wayve).
- Net-net, the UK is pairing public compute and safety funding with large private capex; how quickly this converts into usable capacity will hinge on power, sites and specialised talent.
- We note that Teesside is shaping up as the UK’s second pole for AI infrastructure, with the Teesworks site earmarked for what officials bill as Europe’s largest AI data-centre campus inside a new AI Growth Zone. Planning has advanced and a large tech company is reportedly in talks, promising thousands of jobs across construction and operations, faster grid upgrades on the estuary, and a pipeline of local talent via Teesside University’s expanding AI courses. While national approvals, long-term power deals and an anchor-tenant announcement are still to come.
Conclusion
- The stakes in AI are high, delivery is going to be very, very demanding for market participants.
- The direction is clear—and decisively positive for the UK, both by spreading growth beyond the South-East and by deepening domestic capacity in advanced computing.
Market assumption approach
 Approach
The principle is to consider typical eight-year returns based on where we are in the economic cycle.
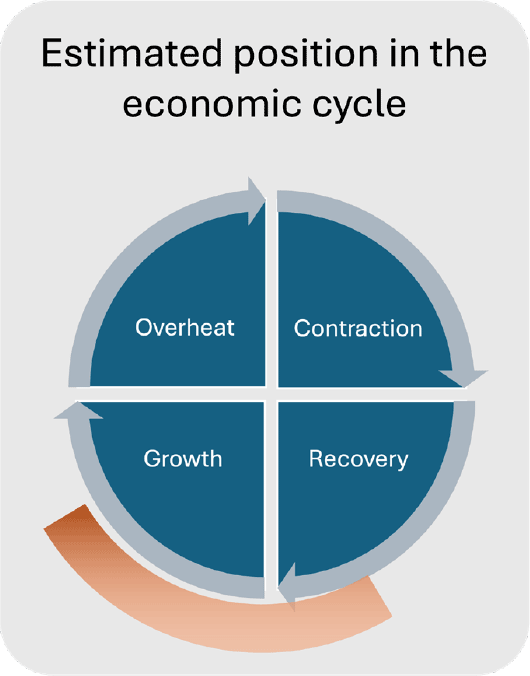
A classical view of the economic cycle is that the economy moves through four stages, growth; economic overheat, requiring intervention from central banks to temper inflation; contraction requiring economic stimulus to get the economy back on its feet; and then recovery as stimulus is scaled back. In real-life the economy can move backwards or skip a stage compared to this simplified representation.
Market returns can also be impacted by events that fall outside of this cyclical macro-economic behaviour. Covid-19 was one such example which led to the global economy cycling very quickly through contraction and back into overheat.
Whilst stock market crashes are possible at all stages of the economic cycle, they are more likely to be deeper and felt wider across the economy when the cycle moves from overheat into contraction.
Position in the economic cycle
Global markets remain anchored by US data and policy, with growth still positive but increasingly uneven. Manufacturing and capex are reviving, while labour markets soften and consumer momentum cools. Fed rate cuts and targeted fiscal spending provide recovery‑like support, yet inflation risks and heightened uncertainty from tariffs, fiscal deficits and the US government shutdown keep central banks cautious. We have weighted our analysis as 20% recovery and 80% growth.
Estimating returns
The return for cash is the SONIA overnight rate for cash expressed as an annualised return.
For assets in the Fixed Income asset classes, we used the latest eight-year yield to maturity as the annualised return for each of the sub-asset classes. This is to avoid any arbitrage opportunities within the market return estimates.
For Equities and remaining asset classes, our market data from 1971 is partitioned into four economic stages – Growth, Overheat, Contraction and Recovery. Then we have calculated annualised risk and return for each index over rolling two-year and eight-year periods. The analysis is done net of UK inflation. We have then added back in current expectations of eight-year UK inflation to give a return expectation based on current inflation expectations and a probabilistic weighting of where we are in the economic cycle.
Manual adjustments to reflect efficient market pricing
Some risky asset classes do not fit on a neat risk return spectrum, such as the FTSE All-Share AIM historical risk, and Emerging Market historical returns. For example, FTSE AIM exhibits moderate volatility and very poor historical downside events. Conversely, Emerging Markets has high volatility but low historical returns. For parity, we adjusted FTSE AIM risk upwards in line with observed downside performance. The Emerging Market equity returns were adjusted upwards to be in line with a capital asset pricing model (CAPM), in essence this means that an investor would expect to be compensated with more return for taking on more risk in Emerging Market equities.
Asset class assumptions
Notes on returns and risks given in the table below
Calculation date: 13th October 2025
Assumptions: Nominal returns and risks
Risk horizon: 2 years
Return horizon: 8 years
Yield: Prevailing market rates as at calculation date
Inflation basis: UK market rates from the Bank of England at calculation date
Cycle basis: 20% Recovery; 80% Growth

Further information
For further information on this document please contact

Managing Director
Dorey Financial Modelling
Office 1, Floor 4
2 Cornet Street
St Peter Port, GY1 1BZ
Email: martyn.dorey@doreyltd.com
Direct: 01481 740560
Office: 01481 729044
Mobile: 07839 700717
Web: www.doreyltd.com

Trainee Actuary
Dorey Financial Modelling
First Floor, Suite 10,
The New Mill House,
Chesterton Mill, French’s Road,
Cambridge CB4 3NP
Email: Robert.Whitfield@doreyltd.com
Direct:01481 740568
Office: 01481 729044
Mobile: 07792 851064
Web: www.doreyltd.com

Consultant
Dorey Financial Modelling
Office 1, Floor 4
2 Cornet Street
St Peter Port, GY1 1BZ
Email: Bernadette.kerr@doreyltd.com
Office: 01481 729044
Web: www.doreyltd.com
Important notice
This document has been produced by Dorey Limited, trading as Dorey Financial Modelling. Dorey Financial Modelling does not give advice as to the purchase, sale, subscription for or underwriting of investments, or advice as to the exercise of rights conferred by investments. Dorey Financial Modelling does not perform any delegated investment functions across any of its clients.
Dorey Financial Modelling is not authorised and/or regulated in the United Kingdom by the Financial Conduct Authority (“FCA”) under the Financial Services and Markets Act 2000 or in the Island of Guernsey by the Guernsey Financial Services Commission (“GFSC”). Recipients should also note that they will not be able to bring any complaints about Dorey Financial Modelling to the FCA, the Financial Ombudsman Service or the GFSC or claim compensation from the Financial Services Compensation Scheme.
Certain countries and jurisdictions have restrictions imposed by law on the distribution of information, accordingly, the information that may be viewed is not directed at or intended to be acted upon by anyone in any jurisdiction where it would be unlawful to do so or in which Dorey Financial Modelling would be required to be authorised. It is the responsibility of the recipients to acquaint themselves with and to comply with the laws and regulations that apply to them.
No information given in this document constitutes a solicitation, offer or recommendation by anyone in any jurisdiction to provide any investment advice or services. recipients confirm that they are eligible to view its content. If any Recipient is not eligible, they should not proceed to read this report. The information contained in this report, which does not purport to be comprehensive, has been compiled by Dorey Financial Modelling.
While this information has been compiled in good faith, no representation or warranty, express or implied, is or will be made and no responsibility or liability is or will be accepted by Dorey Financial Modelling, or by any of its respective officers, employees or agents, in relation to the accuracy or completeness of the document or any other written or oral information made available to any interested party, or its advisers and any such liability is expressly disclaimed. In particular, but without prejudice to the generality of the foregoing, no representation or warranty is given as to the achievement or reasonableness of any future projections, estimates or prospects contained in the document or in such other written or oral information.
This document has been compiled and published by Dorey Financial Modelling. To the fullest extent legally permissible, no reproduction, copying, image scanning, storing, recording or (except as required by law) or modifying of the report by any means in any form nor broadcasting or transmission through any medium of any part of the report is permitted without Dorey Financial Modelling’s prior express written consent. All intellectual property rights that belong to Dorey Financial Modelling in respect of the Modelling work supporting this document are reserved.
These Terms are governed by and construed in accordance with the laws of the Island of Guernsey and Dorey Financial Modelling and all recipients hereby submit to the non-exclusive jurisdiction of the Courts of the Island of Guernsey.
By viewing this document, recipients agree to be bound by the foregoing Terms.

