Market Update Q2 2026
15th May 2026
Market snapshot: Q2 2026
Markets trend higher, with volatility increasingly short-lived rather than sustained
Investors are reacting quickly to news and Presidential tweets, e.g. on/off peace talks, but revert to underlying trends supported by earnings and momentum. US underlying growth is strong. Central-bank path pricing is “higher for longer.” Broad productivity is consistent with growth but mid-cap pricing is subdued.

Movements relative to previous quarterly update.
* Returns above are calculated from the GBP total return index of each index, ** returns in GBP to 14/04/2026; ¹ previously reported reverse repo rate. Replaced with one-year Loan Prime Rate (LPR) for this and future reports; ² previously deflation – shift to inflation a positive move for the economy, 2.0% assumed ‘healthy’
Macroeconomic outlook: Conflicting policy pressures amid heightened uncertainty
Recent signs of overheating are largely supply-driven by oil shocks. With inflation driven by oil supply constraints due to the closure of Hormuz, central banks face a trade-off: addressing inflation or crippling employment. In the middle of an oil shock, as we are today, policymakers are waiting and seeing.
- Inflation – A 97% drop in Strait of Hormuz shipping has driven sharp rises in oil and LNG, with broader commodity impacts, given one-third of fertiliser trade flows through it. These pressures are not yet fully reflected in inflation due to lags, though US data shows energy inflation up 12.5% month-on-month while core declined.
- Employment – Unemployment diverged: the US improved slightly as the labour market stabilised despite slower hiring, Europe remained broadly steady supported by structural labour shortages, while the UK weakened under higher labour costs and softer demand.
- Interest rates – Interest rates were held across the board, with markets scaling back expectations of cuts this year. Central bank actions will depend on the size, persistence, and propagation of price shocks, especially whether it spills into wages, expectations, and broader prices.
UK markets
The UK is very resilient, benefiting from a heavy weighting to energy and commodity-linked sectors, alongside defence, which have outperformed in the current environment. Consumer-facing and rate-sensitive sectors lagged, reflecting pressure from weaker demand and higher borrowing costs, while other areas saw more modest gains. Market performance is increasingly driven by sectoral positioning – particularly exposure to energy, infrastructure, and income-generating sectors.
Outlook – Reshaping of global order accelerates, inflation a primary macro concern
- US credibility stays in spotlight – Policy stability is critical to addressing inflation, yet uncertainty around geopolitical escalation and integrity in policy-setting in the US risks undermining success in avoiding stagflation. US productivity is high, but consumer confidence is historically weak, underscoring a fragile macro backdrop. Trump’s planned May China visit—the first by a US president in nearly a decade. The US wants Boeing orders, China wants stability, and comes amid Beijing’s criticism of Iran strikes, underscoring the importance of avoiding escalation.
- Hungary election shifts EU decision dynamics – Hungary’s recent election delivered a new majority, enabling the new ruling party ‘Tisza’ to reverse illiberal legislation and remove a key veto constraint for EU decisions, including support for Ukraine. This improves cohesion within the bloc at a critical time for trade, defence, and diplomatic positioning.
- China’s strategic march continues – Gold fell sharply off highs, down 12% in March – its worst monthly drop since 2008 – as the attack on Iran pushed the dollar higher. China took advantage, extending its 17-month buying streak, reinforcing gold as a strategic hedge against USD assets.
Gulf war: supply-inflation
The closure of Hormuz
The immediate market question is how quickly energy, LNG, fertiliser, freight and insurance costs pass through to food, goods and inflation expectations.
- The global fertiliser trade is crippled as approximately one-third of the world’s seaborne fertiliser passes through the Hormuz bottleneck. The blockage of Gulf-based producers, particularly affecting nitrogen (urea) and phosphate supplies, has caused severe shortages, increased shipping costs, and sparked 20-30% price spikes, risking higher global food prices into next year.
- Rising food prices will impact on the cost of living into next year regardless of the Strait reopening quickly.
- Saudi Aramco reported a significant 25% jump in net profit to US$32.5 billion for the first quarter of 2026, driven by higher oil prices resulting from disruptions in the Strait of Hormuz. Despite the operational challenges and geopolitical tensions, the company outperformed market forecasts due to increased crude prices and the strategic use of its East-West Pipeline to maintain exports bypassing the Strait of Hormuz. Saudi’s relative position is now very strong against other Gulf producers with fewer bypass options.
- US shale producers are projected to gain over $60 billion in additional revenue. Shareholder Gains: Profits are being passed to shareholders through increased stock buybacks and dividends. For example, Exxon Mobil’s plan to raise its buyback to $30 billion. US oil exports have hit record levels (5.2 million barrels a day), allowing American companies to capture a larger share of the global market. While producers benefit, the broader US economy faces a dilemma, as high oil prices drive up gasoline costs, transport expenses, and overall inflation, impacting consumer spending.
- Russian oil and gas volume levels have continued to drop due to Ukrainian degradation of Russian infrastructure, however high prices have doubled revenues and allowed the Kremlin to fund its deficit and military spending. The Russian shadow fleet of tankers is likely to come under increased Ukrainian targeting. It’s worth noting that Russia faced net territorial losses in April 2026 for the first time since August 2024, and the “character of the war” is changing with losses exceeding recruitment capabilities.
An expected oil glut
The current oil supply squeeze is expected to lead to an oversupply into 2027.
- UAE’s exit from OPEC in May 2026 has triggered a crisis in the oil cartel. The remaining OPEC+ members led by Saudi Arabia and Russia announced a symbolic increase of 188,000 barrels per day.
- Non-OPEC growth has seen increased output from the US, Brazil and Canada which will saturate the market.
- The International Energy Agency is now forecasting a sharp demand decline of over 4 million barrels per day in Q2 2026 as high fuel costs and war-driven economic slowdowns hit global consumption.
- If Saudi Arabia also shifts to maximise market share using its pipeline to the Red Sea, then this will compound a future oversupply of oil. Citibank, Rystad Energy, S&P Global and J.P. Morgan all envision crude oil dropping from a current $100 a barrel to $60 a barrel.
- Russia is fully aware that an oil glut in 2027 is expected to place Russia in a severe revenue expenditure squeeze and Russia would likely exhaust the remaining liquid assets in Russia’s National Wealth Fund. Negotiators from Russia are sounding notes that the Russian war economy cannot last forever.
Current situation and inflation transmission

Current situation
- Ceasefire remains fragile – Drone and shipping incidents continue to test the pause, while talks hinge on reopening the Strait and Iran’s nuclear programme.
- Traffic remains constrained – Polymarket prices low odds of normal Strait traffic, suggesting very low near-term normalisation confidence.
- Asia most exposed – Asia takes the bulk of Gulf crude shipments; subsidy and import-duty responses are already straining public finances.
- Lagged oil shock – Inventories and emergency reserves are being depleted, so CPI effects may continue even if a political deal is announced.
Inflation transmission
- Energy & LNG – Higher power, heating and transport costs; weaker import currencies amplify pass-through.
- Fertiliser & food – Gas feedstock and Gulf exports push urea/fertiliser higher, widening food-cost risk.
- Freight & insurance – Rerouting, bunker fuel and war-risk premia raise delivered-goods costs.
- Policy trade-off – Central banks can slow demand, but cannot reopen a shipping lane; wage/expectation spillover is the key risk.
Supply shock path

Market interpretation
- Inflation – Is likely to remain noisy and headline-driven; food and energy lags mean March/April data may understate the full effect.
- Central banks – Are more likely to delay cuts than to tighten aggressively unless the shock spills into wages, inflation expectations or broad core prices.
- Growth – Risk is concentrated in energy importers and lower-income households; US and commodity-exporter resilience explains equity-market divergence.
- Key watch – Is not one diplomatic headline, but vessel movements, insurance costs, inventory drawdown and the physical-futures oil spread.
Sources: AP, Reuters, UNCTAD, World Bank, Polymarket; accessed 10 May 2026. Q2 draft already notes a 97% fall in Hormuz shipping and rising oil/LNG/fertiliser pressure.
Investment response
Investors are balancing headline relief rallies against physical-market stress and delayed rate cuts
The current response is not a single risk-off trade. It is a rotation toward resilience, cash-flow visibility and inflation-aware exposure, while AI/earnings continue to support broad equity sentiment.
Risk assets
- Equities have been resilient – AI leadership and earnings momentum have offset some war risk.
- Peace headlines matter – Stocks and bonds rally when deal reports hit; energy stocks can lag on de-escalation.
- Risk – Markets may be relying on futures optimism while physical oil stays tight.
Commodities and real assets
- Physical oil is the stress point – Actual barrels have priced tighter than futures.
- Real-economy assets – Energy, materials, utilities and infrastructure are favoured for pricing power.
- Crowding risk – Gold and defence can sell off first when managers raise cash mechanically.
Rates and bonds
- Cut expectations pushed out – Oil and food pass-through make central banks cautious.
- Long duration vulnerable – Even inflation-linked bonds can fall when real yields rise.
- Bond prices are falling and yields are rising – The yield curve is under stress, especially in long maturities; and the UK is being penalised more than the US due to political instability.
Regional and political lens
- US relatively insulated – Less oil-intense and more hydrocarbon self-sufficient than Europe or Asia.
- Asia/EM importers exposed – Currencies, subsidies and current-account balances bear the shock.
- UK – Gilts/sterling sensitive to leadership risk and fiscal slippage.
The US China summit is a tactical truce
Trump’s Beijing visit sits at the intersection of three market risks: Hormuz/Iran, tariffs/critical minerals, and Taiwan/Indo-Pacific credibility.
Expected agenda
- US asks – Chinese support to reopen Hormuz, purchases of US goods, rare-earth supply, fentanyl precursor controls and possible AI discussions.
- China asks – Tariff predictability, investment access, recognition of China’s stature, and a more favourable US stance on Taiwan.
- Delegation signal – Smaller CEO group points to managed trade and limited expectations, not a 2017-style deal tour.
- Polymarket – 96% odds Trump visits China by 30 June; 58% odds of a US-China tariff agreement by 31 May.
Market markers to watch
- Hormuz – Any Chinese pressure on Iran that converts into vessel movements and lower insurance rates.
- Critical minerals – Rare-earth export assurances or a monitoring mechanism for semis, EVs, defence and industrials.
- Purchases – Boeing, agriculture and energy frameworks may support sentiment but could be non-binding.
- Taiwan – Language on arms sales or independence is the key downside tail risk for Asian risk premia.
Sources: Reuters market commentary on oil shock, equities, bonds/linkers and deal-headline rallies; Q2 draft sector comments; accessed 10 May 2026.
Market assumption approach
 Approach
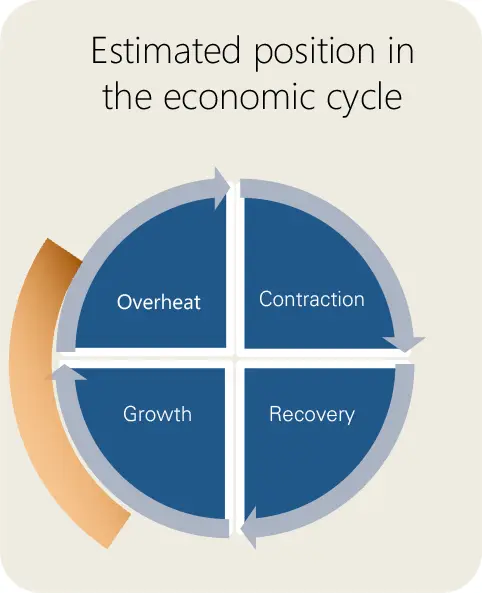
The principle is to consider typical eight-year returns based on where we are in the economic cycle.
A classical view of the economic cycle is that the economy moves through four stages, growth; economic overheat, requiring intervention from central banks to temper inflation; contraction requiring economic stimulus to get the economy back on its feet; and then recovery as stimulus is scaled back. In real-life the economy can move backwards or skip a stage compared to this simplified representation.
Market returns can also be impacted by events that fall outside of this cyclical macro-economic behaviour. Covid-19 was one such example which led to the global economy cycling very quickly through contraction and back into overheat.
Whilst stock market crashes are possible at all stages of the economic cycle, they are more likely to be deeper and felt wider across the economy when the cycle moves from overheat into contraction.
Position in the economic cycle
Inflation remains supply-side driven, originating in pandemic disruptions and amplified by the war in Ukraine, tariffs, and current Iran-related risks. Trump’s “emergency” tariffs were ruled unlawful by the Supreme Court in February, but the administration is already pursuing alternative routes to maintain trade pressure. Rising energy demand linked to AI is compounding inflation pressure in the US. At the same time, US consumer sentiment has fallen to one of its lowest points in decades, highlighting weak confidence at a point where policy stability is critical. Instead, institutional uncertainty is increasing, with continued pressure from Trump on Fed Chair Powell and questions around Kevin Warsh’s independence raising concerns over policy credibility ahead of mid-term dynamics. While fundamentals still underpin (muted) expansion, the key risk is a cost-driven ‘overheat’. We have weighted our analysis as 67% growth, 33% overheat.
Estimating returns
The return for cash is the SONIA overnight rate for cash expressed as an annualised return.
For assets in the Fixed Income asset classes, we used the latest eight-year yield to maturity as the annualised return for each of the sub-asset classes. This is to avoid any arbitrage opportunities within the market return estimates.
For Equities and remaining asset classes, our market data from 1971 is partitioned into four economic stages – Growth, Overheat, Contraction and Recovery. Then we have calculated annualised risk and return for each index over rolling two-year and eight-year periods. The analysis is done net of UK inflation. We have then added back in current expectations of eight-year UK inflation to give a return expectation based on current inflation expectations and a probabilistic weighting of where we are in the economic cycle.
Manual adjustments to reflect efficient market pricing
Some risky asset classes do not fit on a neat risk return spectrum, such as the FTSE All-Share AIM historical risk, and Emerging Market historical returns. For example, FTSE AIM exhibits moderate volatility and very poor historical downside events. Conversely, Emerging Markets has high volatility but low historical returns. For parity, we adjusted FTSE AIM risk upwards in line with observed downside performance. The Emerging Market equity returns were adjusted upwards to be in line with a capital asset pricing model (CAPM), in essence this means that an investor would expect to be compensated with more return for taking on more risk in Emerging Market equities.
Asset class assumptions
Notes on returns and risks given in the table below
Calculation date: 10th April 2026
Assumptions: Nominal returns and risks
Risk horizon: 2 years
Return horizon: 8 years
Yield: Prevailing market rates as at calculation date
Inflation basis: UK market rates from the Bank of England at calculation date
Cycle basis: 67% Growth, 33% Overheat

Further information
For further information on this document please contact

Managing Director
Dorey Financial Modelling
Office 1, Floor 4
2 Cornet Street
St Peter Port
Guernsey GY1 1BZ
Email: martyn.dorey@doreyltd.com
Direct: 01481 740560
Office: 01481 729044
Mobile: 07839 700717
Web: www.doreyltd.com

Associate Actuary
Dorey Financial Modelling
First Floor, Suite 10,
The New Mill House,
Chesterton Mill, French’s Road,
Cambridge CB4 3NP
Email: Robert.Whitfield@doreyltd.com
Direct: 01481 740568
Office: 01481 729044
Mobile: 07792 851064
Web: www.doreyltd.com

Consultant
Dorey Financial Modelling
Office 1, Floor 4
2 Cornet Street
St Peter Port
Guernsey GY1 1BZ
Email: Bernadette.kerr@doreyltd.com
Office: 01481 729044
Web: www.doreyltd.com
Important notice
This document has been produced by Dorey Limited, trading as Dorey Financial Modelling. Dorey Financial Modelling does not give advice as to the purchase, sale, subscription for or underwriting of investments, or advice as to the exercise of rights conferred by investments. Dorey Financial Modelling does not perform any delegated investment functions across any of its clients.
Dorey Financial Modelling is not authorised and/or regulated in the United Kingdom by the Financial Conduct Authority (“FCA”) under the Financial Services and Markets Act 2000 or in the Island of Guernsey by the Guernsey Financial Services Commission (“GFSC”). Recipients should also note that they will not be able to bring any complaints about Dorey Financial Modelling to the FCA, the Financial Ombudsman Service or the GFSC or claim compensation from the Financial Services Compensation Scheme.
Certain countries and jurisdictions have restrictions imposed by law on the distribution of information, accordingly, the information that may be viewed is not directed at or intended to be acted upon by anyone in any jurisdiction where it would be unlawful to do so or in which Dorey Financial Modelling would be required to be authorised. It is the responsibility of the recipients to acquaint themselves with and to comply with the laws and regulations that apply to them.
No information given in this document constitutes a solicitation, offer or recommendation by anyone in any jurisdiction to provide any investment advice or services. recipients confirm that they are eligible to view its content. If any Recipient is not eligible, they should not proceed to read this report. The information contained in this report, which does not purport to be comprehensive, has been compiled by Dorey Financial Modelling.
While this information has been compiled in good faith, no representation or warranty, express or implied, is or will be made and no responsibility or liability is or will be accepted by Dorey Financial Modelling, or by any of its respective officers, employees or agents, in relation to the accuracy or completeness of the document or any other written or oral information made available to any interested party, or its advisers and any such liability is expressly disclaimed. In particular, but without prejudice to the generality of the foregoing, no representation or warranty is given as to the achievement or reasonableness of any future projections, estimates or prospects contained in the document or in such other written or oral information.
This document has been compiled and published by Dorey Financial Modelling. To the fullest extent legally permissible, no reproduction, copying, image scanning, storing, recording or (except as required by law) or modifying of the report by any means in any form nor broadcasting or transmission through any medium of any part of the report is permitted without Dorey Financial Modelling’s prior express written consent. All intellectual property rights that belong to Dorey Financial Modelling in respect of the Modelling work supporting this document are reserved.
These Terms are governed by and construed in accordance with the laws of the Island of Guernsey and Dorey Financial Modelling and all recipients hereby submit to the non-exclusive jurisdiction of the Courts of the Island of Guernsey.
By viewing this document, recipients agree to be bound by the foregoing Terms.
