
Market Update Q4 2026
10th November 2026
Market snapshot: Q3 2026
Growth persists amid rising costs and concentration vulnerabilities
Markets were mixed amid renewed inflation pressures, with central banks holding or raising interest rates.
AI concentration risks are rising as financial and commercial interdependence between major players amplifies exposure across equities, credit and infrastructure valuations.
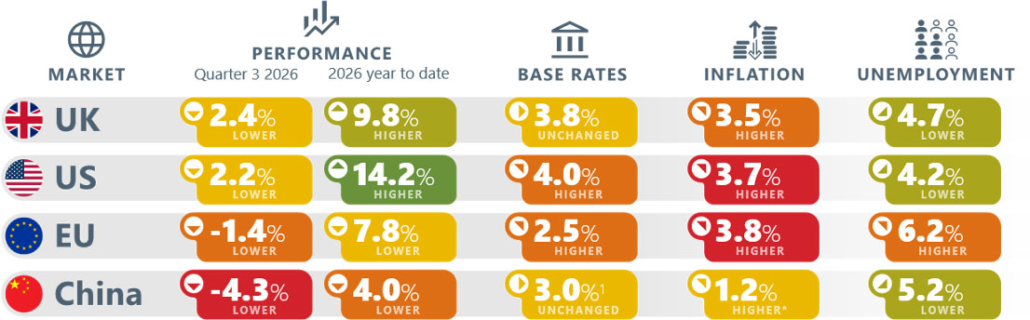
Returns calculated using each index’s GBP total return series not local-currency.
¹ China: 1-year Loan Prime Rate (LPR), a lending reference rate, not a central bank policy rate.
* Modest rise in inflation at this level signals deflationary pressure.
Benchmarks used: UK – FTSE All Share; US – S&P 500; EU – Stoxx Europe 600; China – Shanghai Composite
Macroeconomic outlook: resilient growth, limited policy flexibility
Growth remains positive but uneven, while supply disruption and geopolitical risk premiums sustain inflation. Monetary policy cannot restore supply, leaving bond yields and asset valuations vulnerable.
- Inflation is moving higher again – energy-driven inflation underpins this globally; energy prices are up 18%-20% year-on-year in the major Western economies. Geographical differences remain. In the US, tariffs and supply-chain restructuring combine with resilient domestic demand. In the UK and EU, higher energy costs feed through to transport, production and ultimately consumer prices, despite weak domestic demand.
- Employment is holding up, hiring weaker – Unemployment remains broadly contained, but firms are holding back recruitment across the major economies, making it harder for jobseekers to find work. Youth detachment extends beyond the UK, reported last quarter. Across OECD countries, 14% of 18–24-year-olds are outside work, education or training, with roughly two-thirds excluded from unemployment figures because they are economically inactive. This signals a deeper constraint on growth than headline unemployment figures suggest.
- Interest rates held/increased, little prospect of near-term cuts – The Fed and ECB raised rates, the ECB’s second hike this year. The UK and Euro area face a hard trade-off: restraining inflation risks further weakening growth. Chinese firms are absorbing higher costs not passing them on to consumers. Rate cuts could ease financing costs but may not boost spending while household confidence remains weak.
UK markets
Higher oil prices supported FTSE 100 energy companies but put pressure on prices and borrowing costs for households and businesses. The Government recently approved the Jackdaw gas field, and the Budget committed £2bn to a new Energy Wealth Fund, using tax revenues from North Sea oil and gas to invest in green energy projects. These actions support the UK’s focus on improving energy independence. The Chancellor announced the Data Centre Covenant, which aims to accelerate faster grid access and planning support for strategic AI projects in exchange for commitments on energy costs, water efficiency and local investment. Grid capacity remains a constraint.
Outlook – concentration, Congress and capital costs
- US midterms – The Democrats’ comprehensive victory in both the Senate and the House will restrict Trump’s ability to pass new legislation and influence domestic policy, however the White House will retain substantial trade and foreign-policy powers. The “lame duck” period between the election and the convening of the new Congress on 3 January 2027, will offer Republicans a final opportunity to push through legislation and confirm appointments before Democrats take control, potentially creating a burst of policy activity and further market uncertainty. Page 3 examines market implications.
- AI concentration – Global AI investment is forecast to reach $1 trillion in 2026 alone², comparable to the entire annual US defence budget. Over half of all AI investment since 2022 is expected to occur this year. AI could deliver everything promised technologically yet still disappoint investors financially if commercial returns fall short. Google’s parent company, Alphabet, posted costs on Oct 28th that gave the markets a sharp intake of breath. Pages 4-5 explore the risks of circular financing.
- Cost of capital – Governments and AI companies are competing for long-term capital as persistent inflation limits central banks’ ability to ease monetary policy. Heavy debt issuance and uncertainty over future inflation risk keeping bond yields elevated, even without further interest-rate rises.
² Goldman Sachs Research
Investment notes
Higher yields raise the return investors can demand
Company profits supported equities through the quarter despite higher oil prices and borrowing costs. In late October, concerns about heavy AI spending and the time needed to generate returns prompted a sell-off in technology shares. Higher bond yields give investors more income opportunities, raising the return required from equities and infrastructure.
Risk assets
- Valuations eased against forecast earnings – Profit forecasts outpaced share prices in Q3, compressing earnings multiples. Higher bond yields also increased the return investors require on equity.
- Equity market support – October gains broadened beyond S&P 500 mega caps; record buyback authorisations could support shares once earnings restrictions lift.
- Risk – Demand for downside protection rose in October as earnings results and the approaching US midterms unsettled markets.
Commodities and real assets
- Energy supply – Continued conflict-related disruption in the Gulf and Russia pushed oil and gas prices higher in Q3. Low inventories leave markets more vulnerable to further supply losses.
- Commodity divergence – Fertiliser prices fell 22% during Q3, reversing the same gain in Q2, as the earlier urea shortage eased. Food markets remain exposed to disrupted grain shipments and adverse weather.
- Infrastructure financing – Higher yields weighed on listed infrastructure and property during Q3. Returns depend on revenue arrangements, the cost of expansion and when debt falls due.
- Gold as portfolio insurance – Record Q3 ETF inflows of $31bn pushed holdings to a record 4,256 tonnes, reflecting sustained demand for diversification amid geopolitical and fiscal risks.
Rates and bonds
- Holds and hikes – Persistent inflation limits scope for cuts.
- Long-term yields – Government borrowing and AI competition for capital may keep yields elevated even without rate rises.
- Corporate credit divergence – Corporate credit divergence – High-yield spreads widened, particularly for CCC-rated borrowers, signalling heightened refinancing concerns.
- Emerging market debt optimism – Net inflows into emerging-market debt funds YTD exceeded the whole of 2025. Tight spreads leave investors less compensation for country risk.
Regional and policy lens
- US fiscal negotiations – US fiscal negotiations – Congress must approve funding for federal services by 11 December. The Democratic victory could push an agreement into January, increasing the risk of a government shutdown.
- UK Budget commitments – £15.4bn extra for the National Wealth Fund supports infrastructure and regional investment.
- Europe defence – Rising orders and procurement rules favouring European suppliers support domestic manufacturing and investment in local supply chains.
- China consumption – Subsidies and cheaper consumer loans aim to revive household spending and reduce reliance on exports with trade restrictions. This is in line with IMF recommendations.
- India trade access – The UK trade agreement is now operating, and the EU agreement is progressing towards approval.
- EM double exposure – Almost 90% of MSCI EM comprises net energy importers. AI exports help Taiwan and South Korea, half the index combined, offset higher energy costs, though inflation and currency pressures are building.
Market indicators to watch
- Shipping flows – Gulf oil exports rose by around 10% between July and September as producers made greater use of alternative routes and ship-to-ship transfers. Lower freight and insurance costs would be the next signs of improving conditions.
- Shipping costs – Saudi export routes reopened following September’s disruption, with freight and insurance remaining expensive. Sustained loaded departures and lower delivery costs would be a measure of improved conditions.
- War-risk premiums – Insurance costs remain a significant obstacle to normal shipping. Quotes for Hormuz stayed near July’s elevated levels, while premiums for Saudi-linked tankers calling at Yanbu rose from below 1% in July to around 3% by late September.
- Oil pricing – The premium for near-term Brent delivery increased in October, signalling pressure on available supply. A sustained decline in premiums would indicate that immediate shortages are easing.
- AI credit spreads – Hyperscaler* bond spreads have widened to 119bps against 86bps for broader investment-grade credit. Further divergence would signal investors demanding greater compensation for AI financing risk.
- US long-term yields – Ten-year Treasury yields reached a 24-year high of 5.31% in October, with inflation-adjusted yields at their highest since 2008. Renewed increases would signal growing long-term financing risk and pressure equity valuations. Unexpectedly high issuance of 10- and 30-year Treasuries by the US Government in November could put more upward pressure on yields.
* Hyperscaler: a very large cloud-computing provider operating data-centre infrastructure at global scale, such as Microsoft Azure, Amazon Web Services (AWS) or Google Cloud.
US midterms: fiscal and market implications
Democratic landslide ends Republican control of Congress
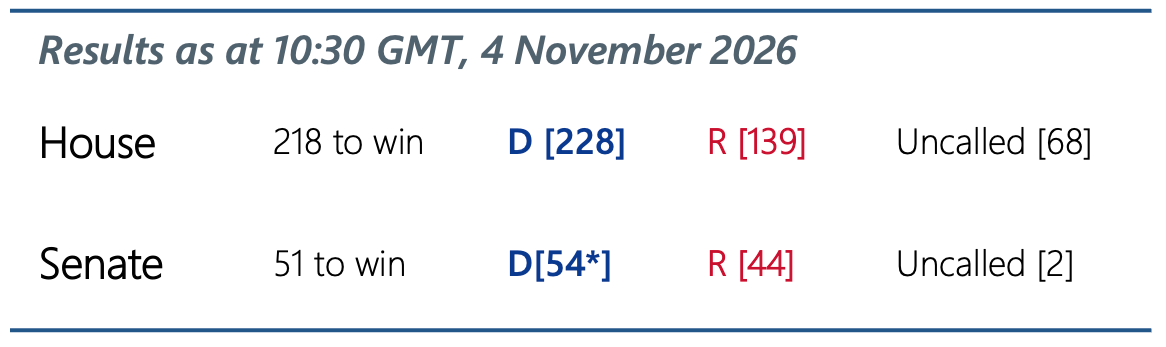
AP-called seats only. Senate totals include seats not contested. *Two Independent senators caucus with Democrats and are included in the Democratic-aligned total when assessing control. House majority 218; Senate control: 51

The Democrats’ resounding midterm victory has secured control of both the House of Representatives and the Senate, significantly restricting Trump’s ability to pass new legislation from January 2027. The Democrats’ midterm victory gives them control of both chambers of Congress from January 2027, limiting Trump’s ability to pass legislation. Democratic gains in Texas, Georgia, Iowa and Ohio also strengthen their influence over state taxation, energy policy and infrastructure. Before the election, Reuters reported that White House officials had spent months exploring executive actions to advance Trump’s agenda, including on tariffs, immigration and the use of congressionally approved funds.
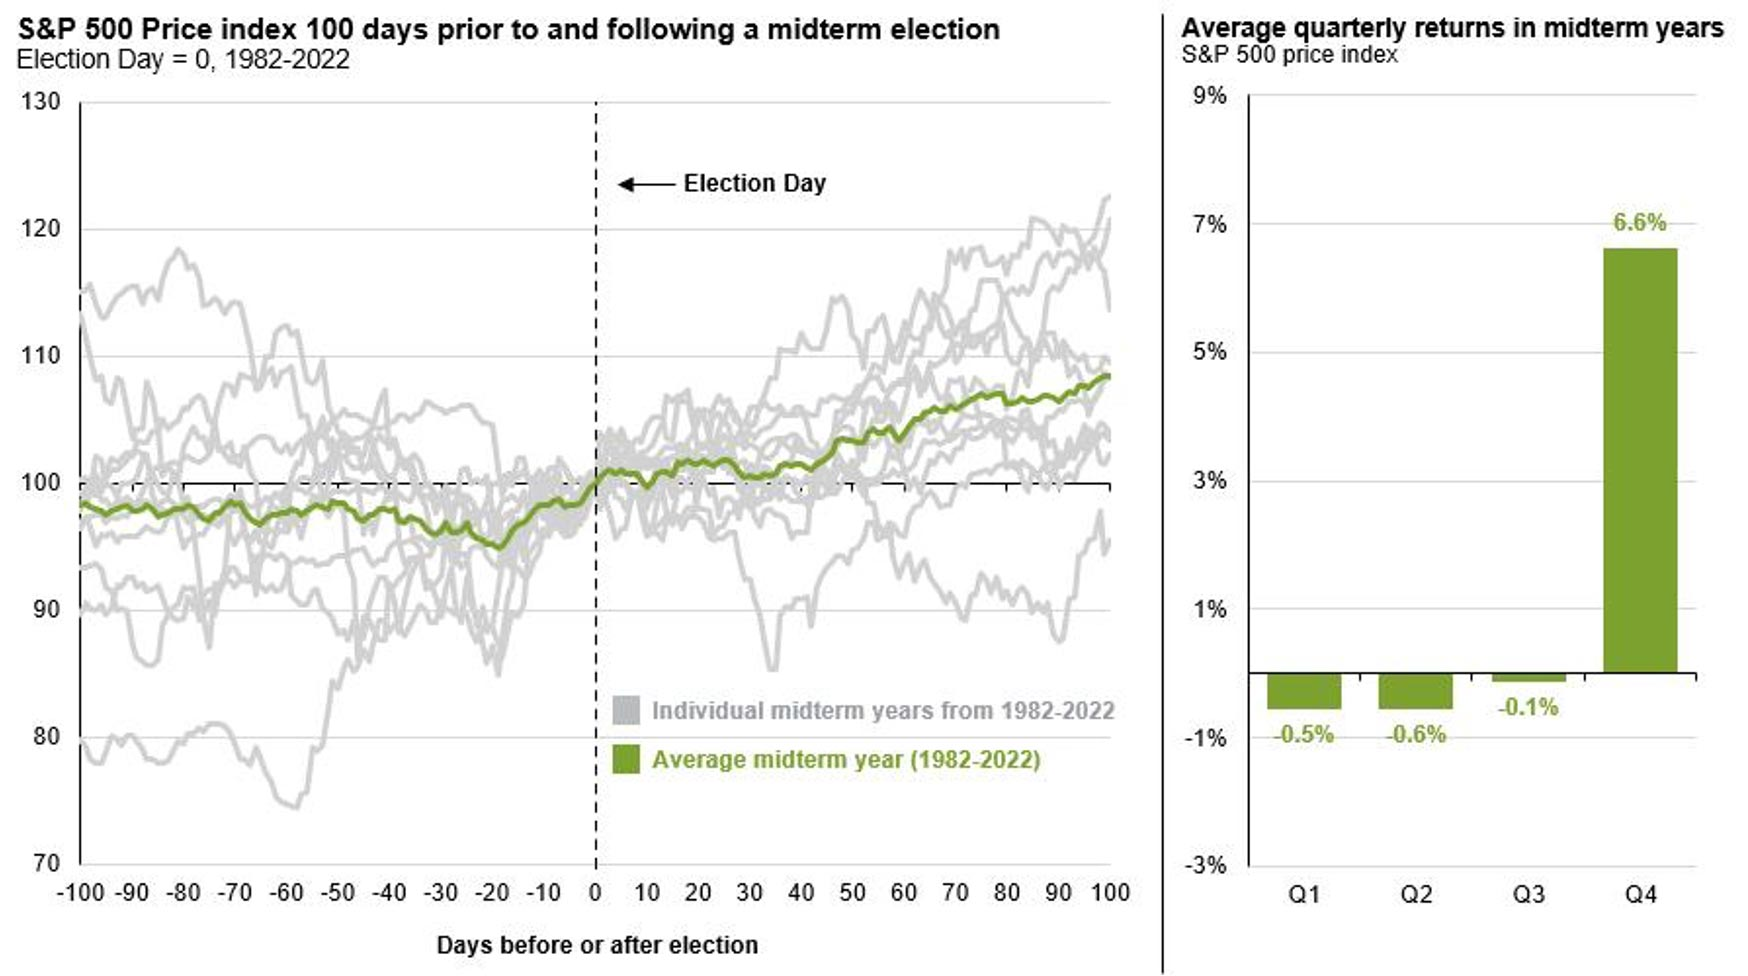
Sources: Standard & Poor’s, FactSet and J.P. Morgan Asset Management, 2026 Midterm Election Hub. S&P 500 price index, 100 days before and after US midterm elections (1982–2022); average quarterly price returns in midterm years. Past performance is not indicative of future returns
Politics vs market returns
Political control is a poor guide to market returns.
Historical performance has varied across different congressional configurations.
Economic growth, earnings, interest rates and valuations have been more important drivers of market performance. However, a backtest provides an interesting comparison of ‘mid-term’ effects.
Historical equity performance around US midterms
US equities have historically strengthened after midterm elections. From 1982 to 2022, the S&P 500 delivered little or no price growth in the first three quarters of midterm years, then gained an average 6.6% in Q4, excluding dividends. This pattern may reflect a recovery as electoral uncertainty fades, though outcomes vary. In 2026, persistent inflation, elevated bond yields and stretched technology valuations may play a larger role in determining whether post-election gains endure.
US: what the midterms could change
- Fiscal policy and bond yields – Democratic control of Congress from January 2027 will constrain Trump’s ability to pass new tax and spending measures, though he can still propose budget priorities, veto legislation and influence the allocation of approved funds. With the FY2026 deficit at $2 trillion, or 6.2% of GDP, substantial funding needs will persist regardless of which party controls Congress. Disputes over defence, infrastructure and other priorities could add to fiscal uncertainty, while expectations of increased Treasury issuance or weaker fiscal discipline could put further upward pressure on long-term yields.
- Foreign policy and military control – Trump retains substantial authority over tariffs, sanctions and military deployments even with Democratic congressional control. Continued disruption to Gulf shipping is keeping oil and gas prices elevated, raising costs for households and businesses. Further escalation could prolong inflationary pressures, weaken growth and constrain central banks’ability to cut rates.
- AI oversight – Democratic control of Congress from January 2027 will enable more extensive investigations into AI companies, particularly data-centre taxation, electricity costs and industry practices. While Trump retains the power to block new legislation, state and local authorities can impose more direct restrictions on data-centre development. Increased scrutiny, higher costs and regulatory uncertainty could disrupt investment plans and pressure valuations in a sector driving US market returns.
Despite the Democrats’ victory in both chambers of Congress, Trump retains substantial influence over trade, sanctions and military decisions, with potentially abrupt consequences for energy prices and inflation. Heavy government borrowing and AI-related investment demand could keep financing costs elevated, posing a greater risk to equity valuations than the election result itself.
Sources: J.P. Morgan Asset Management (2026); Reuters (29 October and 1 November 2026); Congressional Budget Office (October 2026); US Treasury (October 2026); Congressional Research Service (2025–26); International Energy Agency (2026); Goldman Sachs Research (August 2026).
The AI Web and Circular Financing
Financing and revenues are increasingly intertwined
55.2% of incoming investment in AI firms is from other AI firms; 46.4% of the value of AI-to-AI investment deals involved a commercial supply-chain relationship. BIS, 2021–25 dataset
The AI investment ecosystem increasingly links capital provision with commercial demand. Hyperscalers* invest in model developers that buy their compute**; chipmakers invest in infrastructure providers that purchase their hardware; and model developers spread capacity across several cloud and infrastructure partners. These relationships can accelerate investment and secure scarce inputs, but they also create common dependencies that are not visible from conventional company or sector classifications.
The network of current relationships shows how quickly these dependencies can compound. Microsoft/OpenAI, Amazon/Anthropic and NVIDIA/CoreWeave each combine financial and commercial exposure, while compute demand is distributed across a relatively small group of infrastructure providers. As a result, exposures that appear diversified across companies and sectors may still depend on the same underlying AI demand and become stressed at the same time.
AI’s financial and commercial web
Major relationships between model developers, cloud providers and infrastructure suppliers.
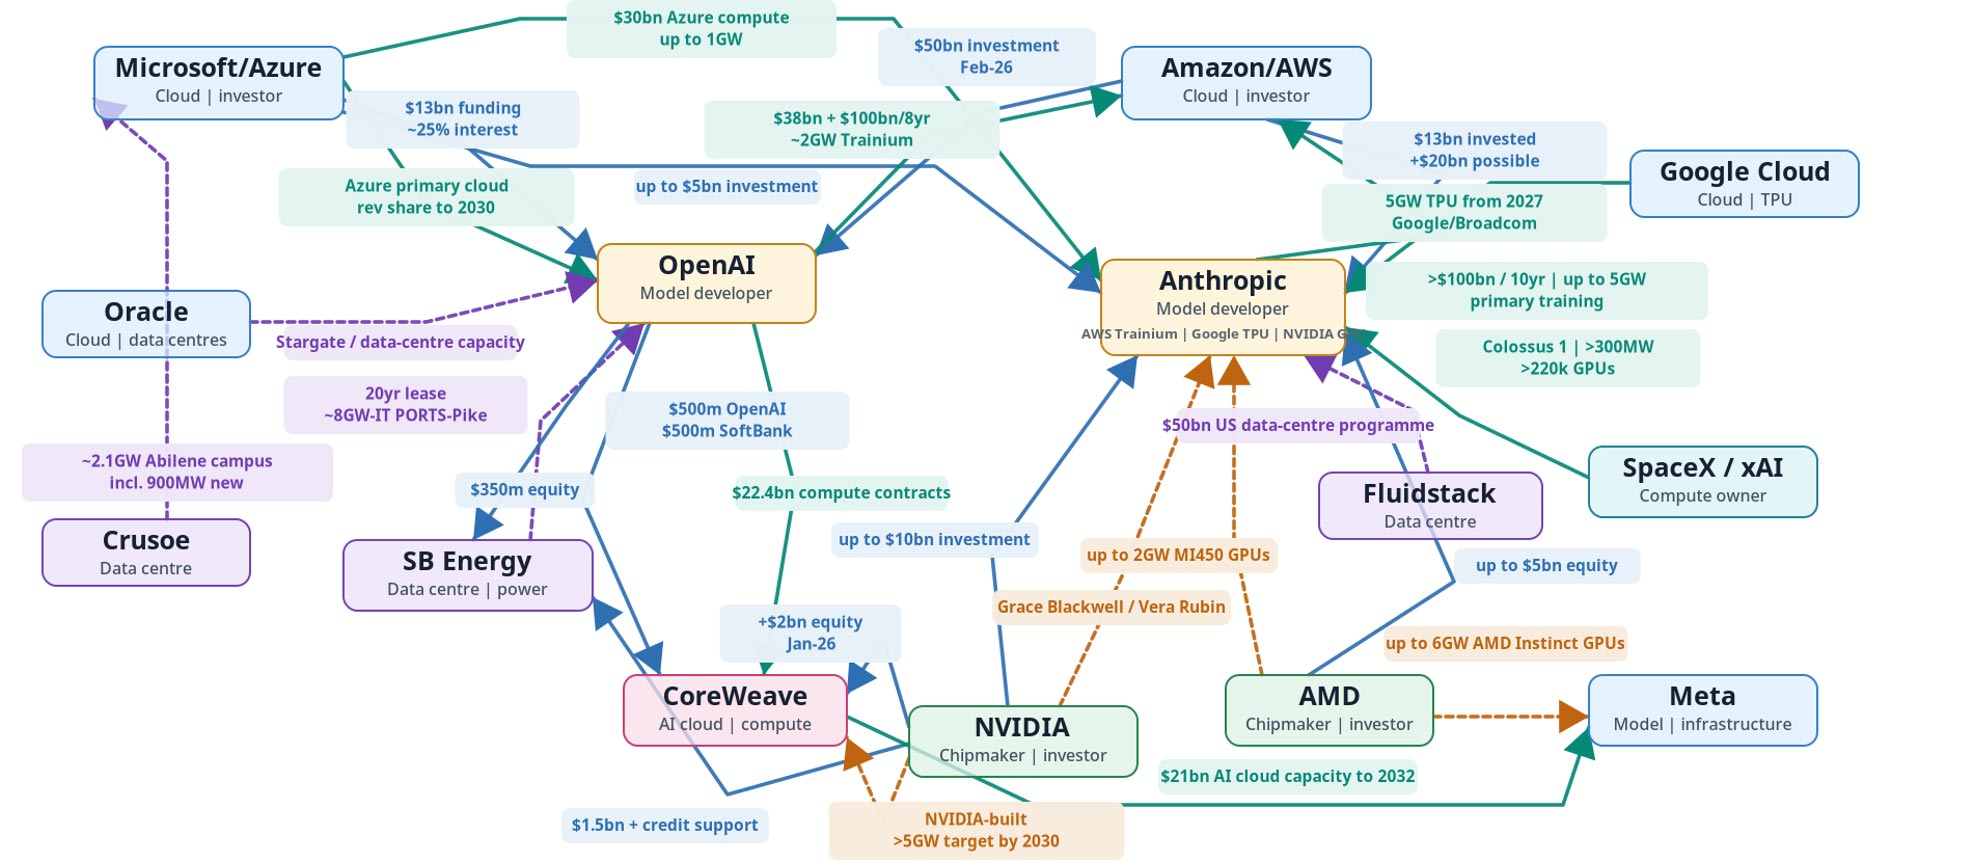
* Hyperscaler: a very large cloud-computing provider operating data-centre infrastructure at global scale, such as Microsoft Azure, Amazon Web Services (AWS) or Google Cloud.
** Compute is the processing capacity used to train and run AI models, typically provided by large clusters of specialised chips housed in data centres.
Circular financing
The web can create circular financing where capital provided to an AI company also supports purchases from the investor or its commercial partners.
Long-term compute and supply agreements can in turn underpin further infrastructure investment. The resulting revenues are real, but their durability depends increasingly on whether demand ultimately converts into cash flow from independent end users rather than continued financing and investment within the AI ecosystem.
The financing profile is also changing. The largest technology companies initially funded AI investment largely from strong operating cash flows, but capital expenditure is increasingly being supplemented by bond issuance, leases, special-purpose vehicles and other forms of credit. Hyperscalers have gone from less than 1% to 10% of global investment-grade bond issuance since 2024 – more than a tenfold increase.
Interconnection increases wrong-way risk
The IMF identified 14 AI financing deals involving approximately $300bn in equity, $650bn in debt and $1.4tn in future purchase commitments.
These arrangements create circular dependencies, where suppliers help finance the customers underpinning their future revenues. If end-user demand falls short of expectations, anticipated revenues, investment values and debt-servicing capacity could deteriorate simultaneously.
The IMF refers to this as “wrong-way risk”.
Sources: BIS Bulletin 137 (Oct 2026); IMF Global Financial Stability Report (Oct 2026); company filings and announcements, 2025–26.
AI investment boom: capacity, credit and demand
Capacity is growing faster than the economics have been tested
Capacity growth alone is consequently a poor proxy for investment success. Investment returns depend on utilisation, pricing and the pace of technological obsolescence. Each generation of more capable hardware also accelerates economic depreciation of older GPUs and increases compute available per dollar of investment.
New global AI computing capacity is doubling every 9 months
Computing capacity of AI chips sold each quarter, by designer
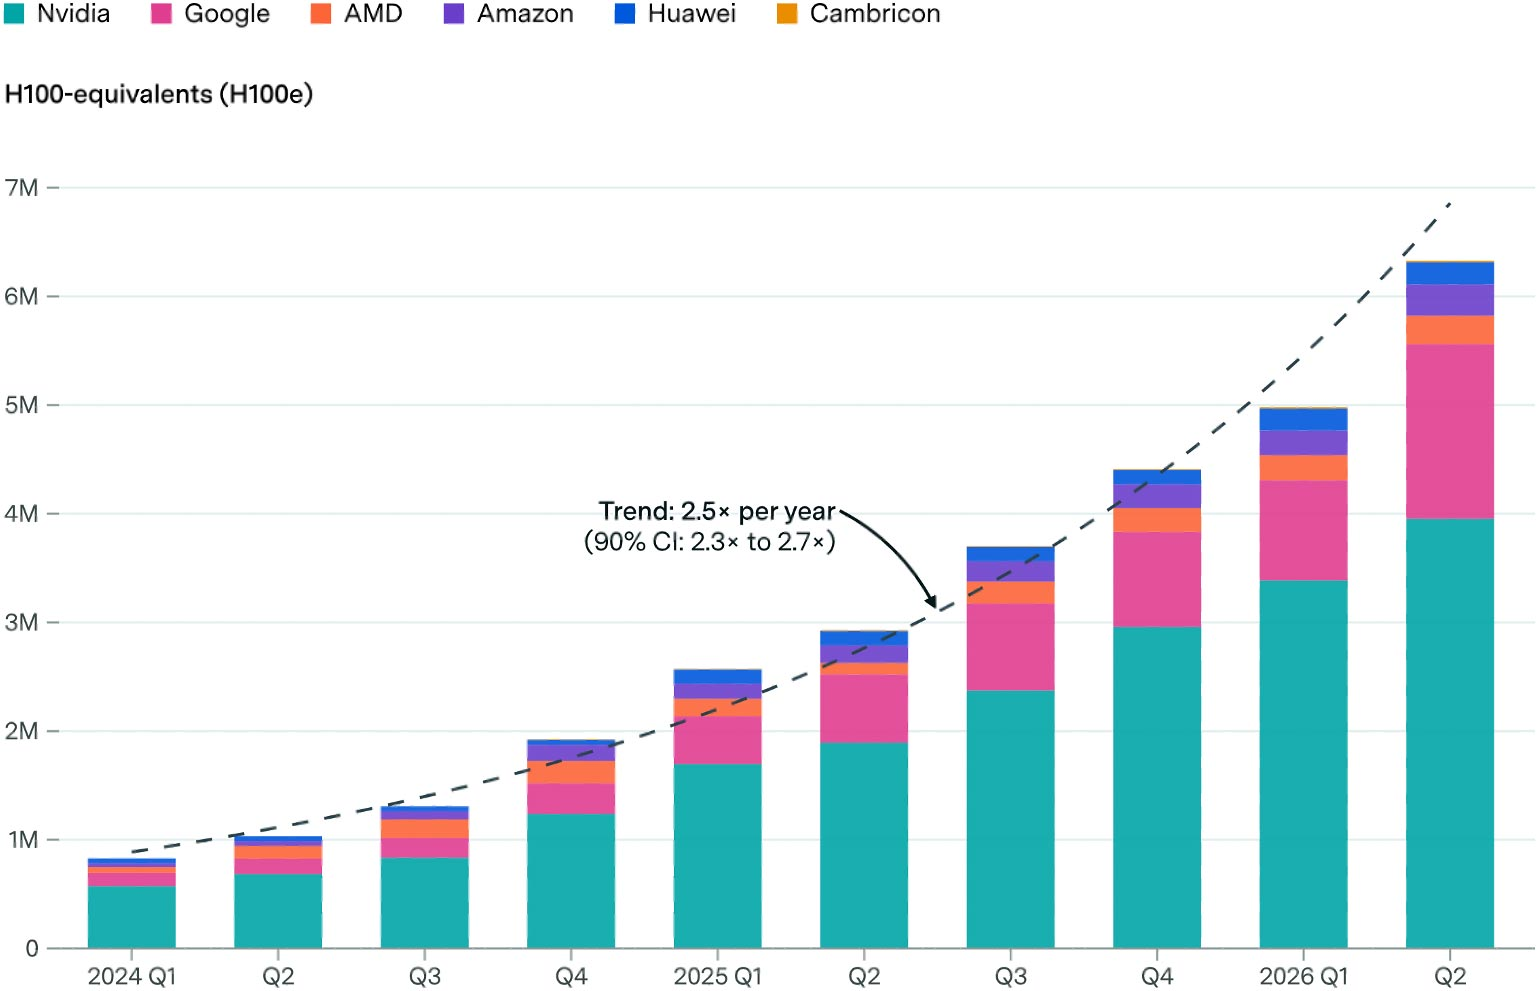
Each dollar invested in AI chips buys ~49% more compute each year
Performance/$ of AI chips sold each quarter, by designer
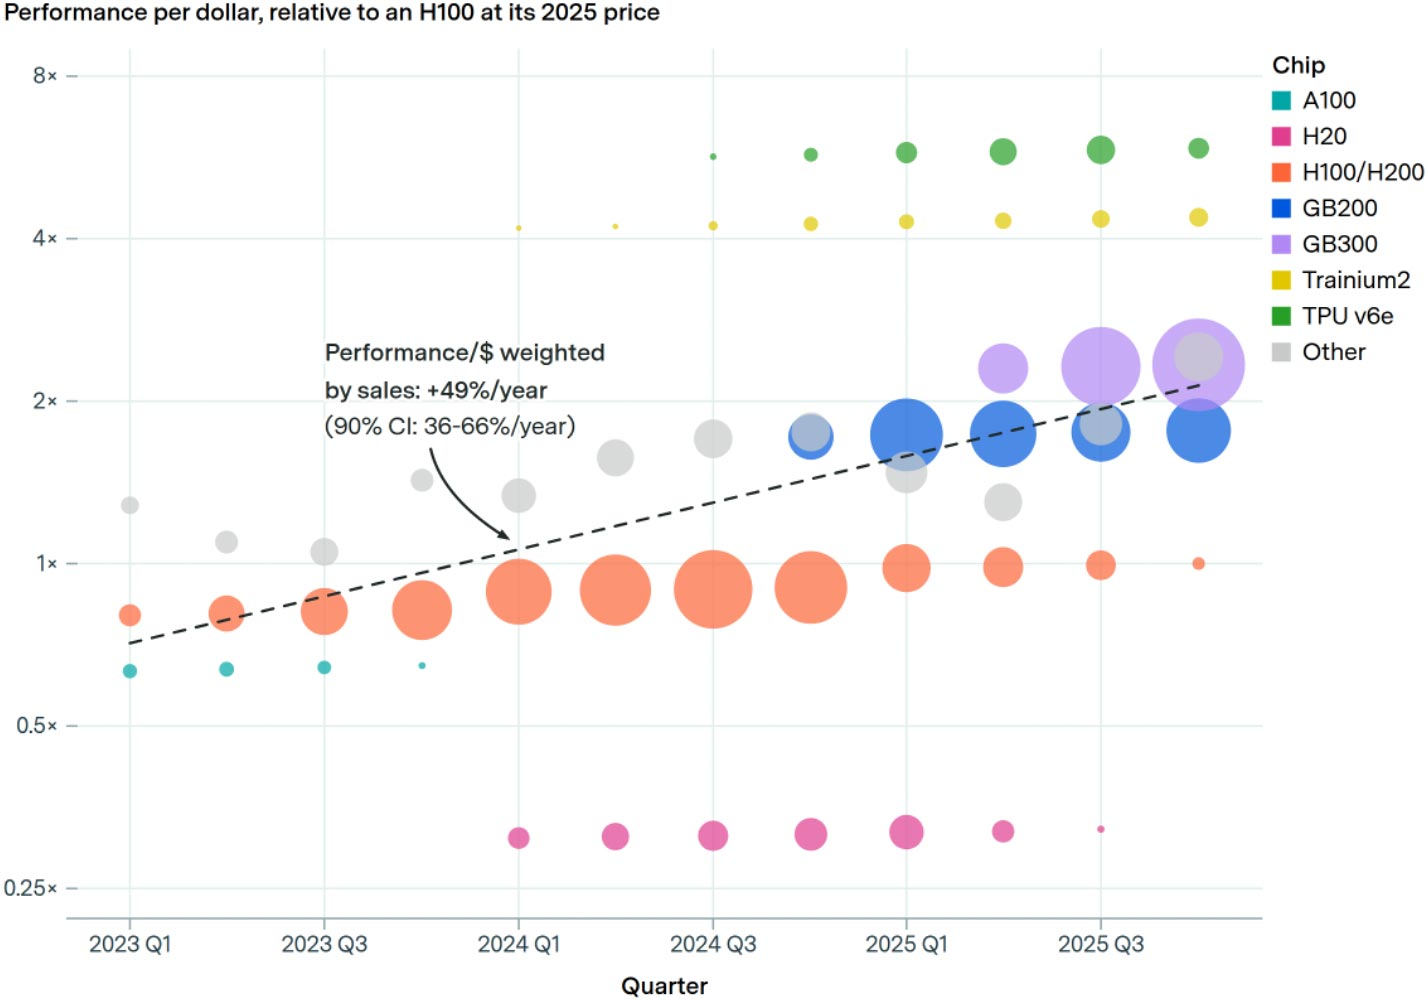
Sources: Epoch AI. All values in 2025 USD. Left chart shows global AI chip capacity sold per quarter in H100-equivalents (H100e), based on median estimates as at 19 October 2026. Right chart shows performance per dollar relative to an H100 at its 2025 price; bubble size reflects quarterly spending. H100e = compute capacity equivalent to one NVIDIA H100 GPU.
Shared resource dependencies can amplify stress across an investment boom
Data-centre electricity demand rose 17% in 2025, while consumption at AI-focused facilities rose about 50%; global data-centre demand is projected to roughly double from 485 TWh in 2025 to 950 TWh by 2030, roughly double 2025 and slightly more than Japan consumes today. Water use is growing rapidly too. US data centres consumed 21 billion litres in 2014 and 66 billion litres in 2023; Berkeley Lab scenarios put direct consumption at 145–275 billion litres by 2028, or as much as four times the 2023 level. Nearly 40% of identified AI-dedicated data-centre capacity is already located in areas of high or extremely high baseline water stress.
Taiwan and South Korea are critical to semiconductor production yet import roughly 98% and 94% of their energy, respectively. A major energy shock could affect chip supply and data-centre economics together, increasing correlation across otherwise separate exposures.
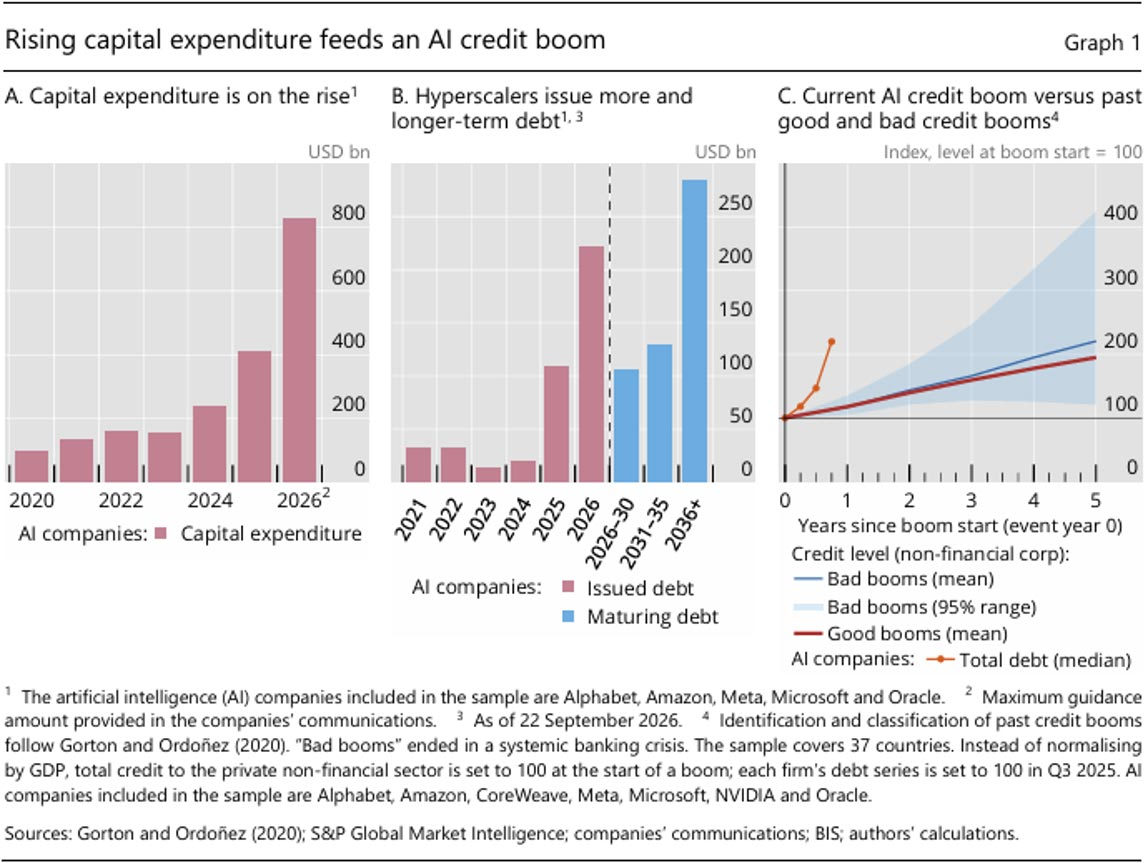
Investment and credit are rising
Capex and borrowing are accelerating together. 2026 capex approaches $800bn, while gross debt issuance jumps to roughly $220bn. The build-out is moving beyond self-financing.
The debt is long-dated. That reduces immediate refinancing pressure, but locks in obligations against revenues from assets whose utilisation, pricing and technological life are still uncertain.
Current debt growth is unusually fast, but successful and unsuccessful historical booms look very similar early on. High debt growth is a vulnerability, not proof of a bubble. Off-balance-sheet vehicles can leave economic leverage understated.
When would the boom start to resemble a bubble?
The critical issue is whether paid demand grows fast enough to absorb rapidly expanding capacity before returns are eroded by obsolescence, financing costs and resource constraints. Risks increase when debt and supplier-financed demand grow faster than end-customer cash flows, particularly where cross-investment and shared dependencies on chips, power and water create correlated exposures across the AI ecosystem.
Sources: BIS Bulletin 140 (Oct 2026); IEA, *Key Questions on Energy and AI* and *Powering Artificial Intelligence* (2026); Lawrence Berkeley National Laboratory (2024); Taiwan Ministry of Economic Affairs; Korea Energy Agency).
Market assumption approach
Approach
The principle is to consider typical eight-year returns based on where we are in the economic cycle.
A classical view of the economic cycle is that the economy moves through four stages: growth, as economic activity and demand strengthen; economic overheat, as inflation and capacity pressures rise; contraction, as economic activity weakens; and recovery, as activity stabilises and begins to improve. In real life, the economy can move backwards or skip a stage compared with this simplified representation..
We use changes in US interest rates and unemployment as a historical reference, alongside broader economic, market and policy analysis, to assess current conditions.
Market returns can also be impacted by events that fall outside of this cyclical macro-economic behaviour. Covid-19 was one such example, causing a sharp contraction followed by a rapid recovery and, in many economies, rising inflation pressures.
Whilst stock market crashes are possible at all stages of the economic cycle, they are more likely to be deeper and felt wider across the economy when the cycle moves from overheat into contraction.
Estimated position in the economic cycle

Position in the economic cycle
The global economy continues to expand at an uneven pace, with labour-market momentum weakening as higher energy costs, trade barriers and capacity constraints sustain inflationary pressure. Central banks consequently have limited scope to reduce interest rates, while elevated bond yields are increasing financing costs and the returns required to justify investment valuations. Strong corporate earnings and substantial AI capital expenditure remain important sources of market support. The growing network of financing, supply and customer relationships surrounding AI is also concentrating exposure across equities, credit and infrastructure, increasing sensitivity to any shortfall in anticipated returns.
We have increased our weighting to Overheat since last quarter to reflect the growing influence of supply-driven inflation and restrictive financial conditions on continued economic expansion. These pressures are raising the cost of investment and leaving markets increasingly dependent on sustained earnings growth and returns from AI expenditure. We have weighted our analysis as 50% Growth, 50% Overheat.
Estimating returns
The return for cash is the SONIA overnight rate for cash expressed as an annualised return.
For assets in the Fixed Income asset classes, we used the latest eight-year yield to maturity as the annualised return for each of the sub-asset classes. This is to avoid any arbitrage opportunities within the market return estimates.
For Equities and remaining asset classes, our market data from 1971 is partitioned into four economic stages – Growth, Overheat, Contraction and Recovery. Then we have calculated annualised risk and return for each index over rolling two-year and eight-year periods. The analysis is done net of UK inflation. We have then added back in current expectations of eight-year UK inflation to give a return expectation based on current inflation expectations and a probabilistic weighting of where we are in the economic cycle.
Manual adjustments to reflect efficient market pricing
Some risky asset classes do not fit on a neat risk return spectrum, such as the FTSE All-Share AIM historical risk, and Emerging Markets historical returns. For example, FTSE AIM exhibits moderate volatility and very poor historical downside events. Conversely, Emerging Markets has high volatility but low historical returns. For parity, we adjusted FTSE AIM risk upwards in line with observed downside performance. The Emerging Market equity returns were adjusted upwards to be in line with a capital asset pricing model (CAPM), in essence this means that an investor would expect to be compensated with more return for taking on more risk in Emerging Market equities.
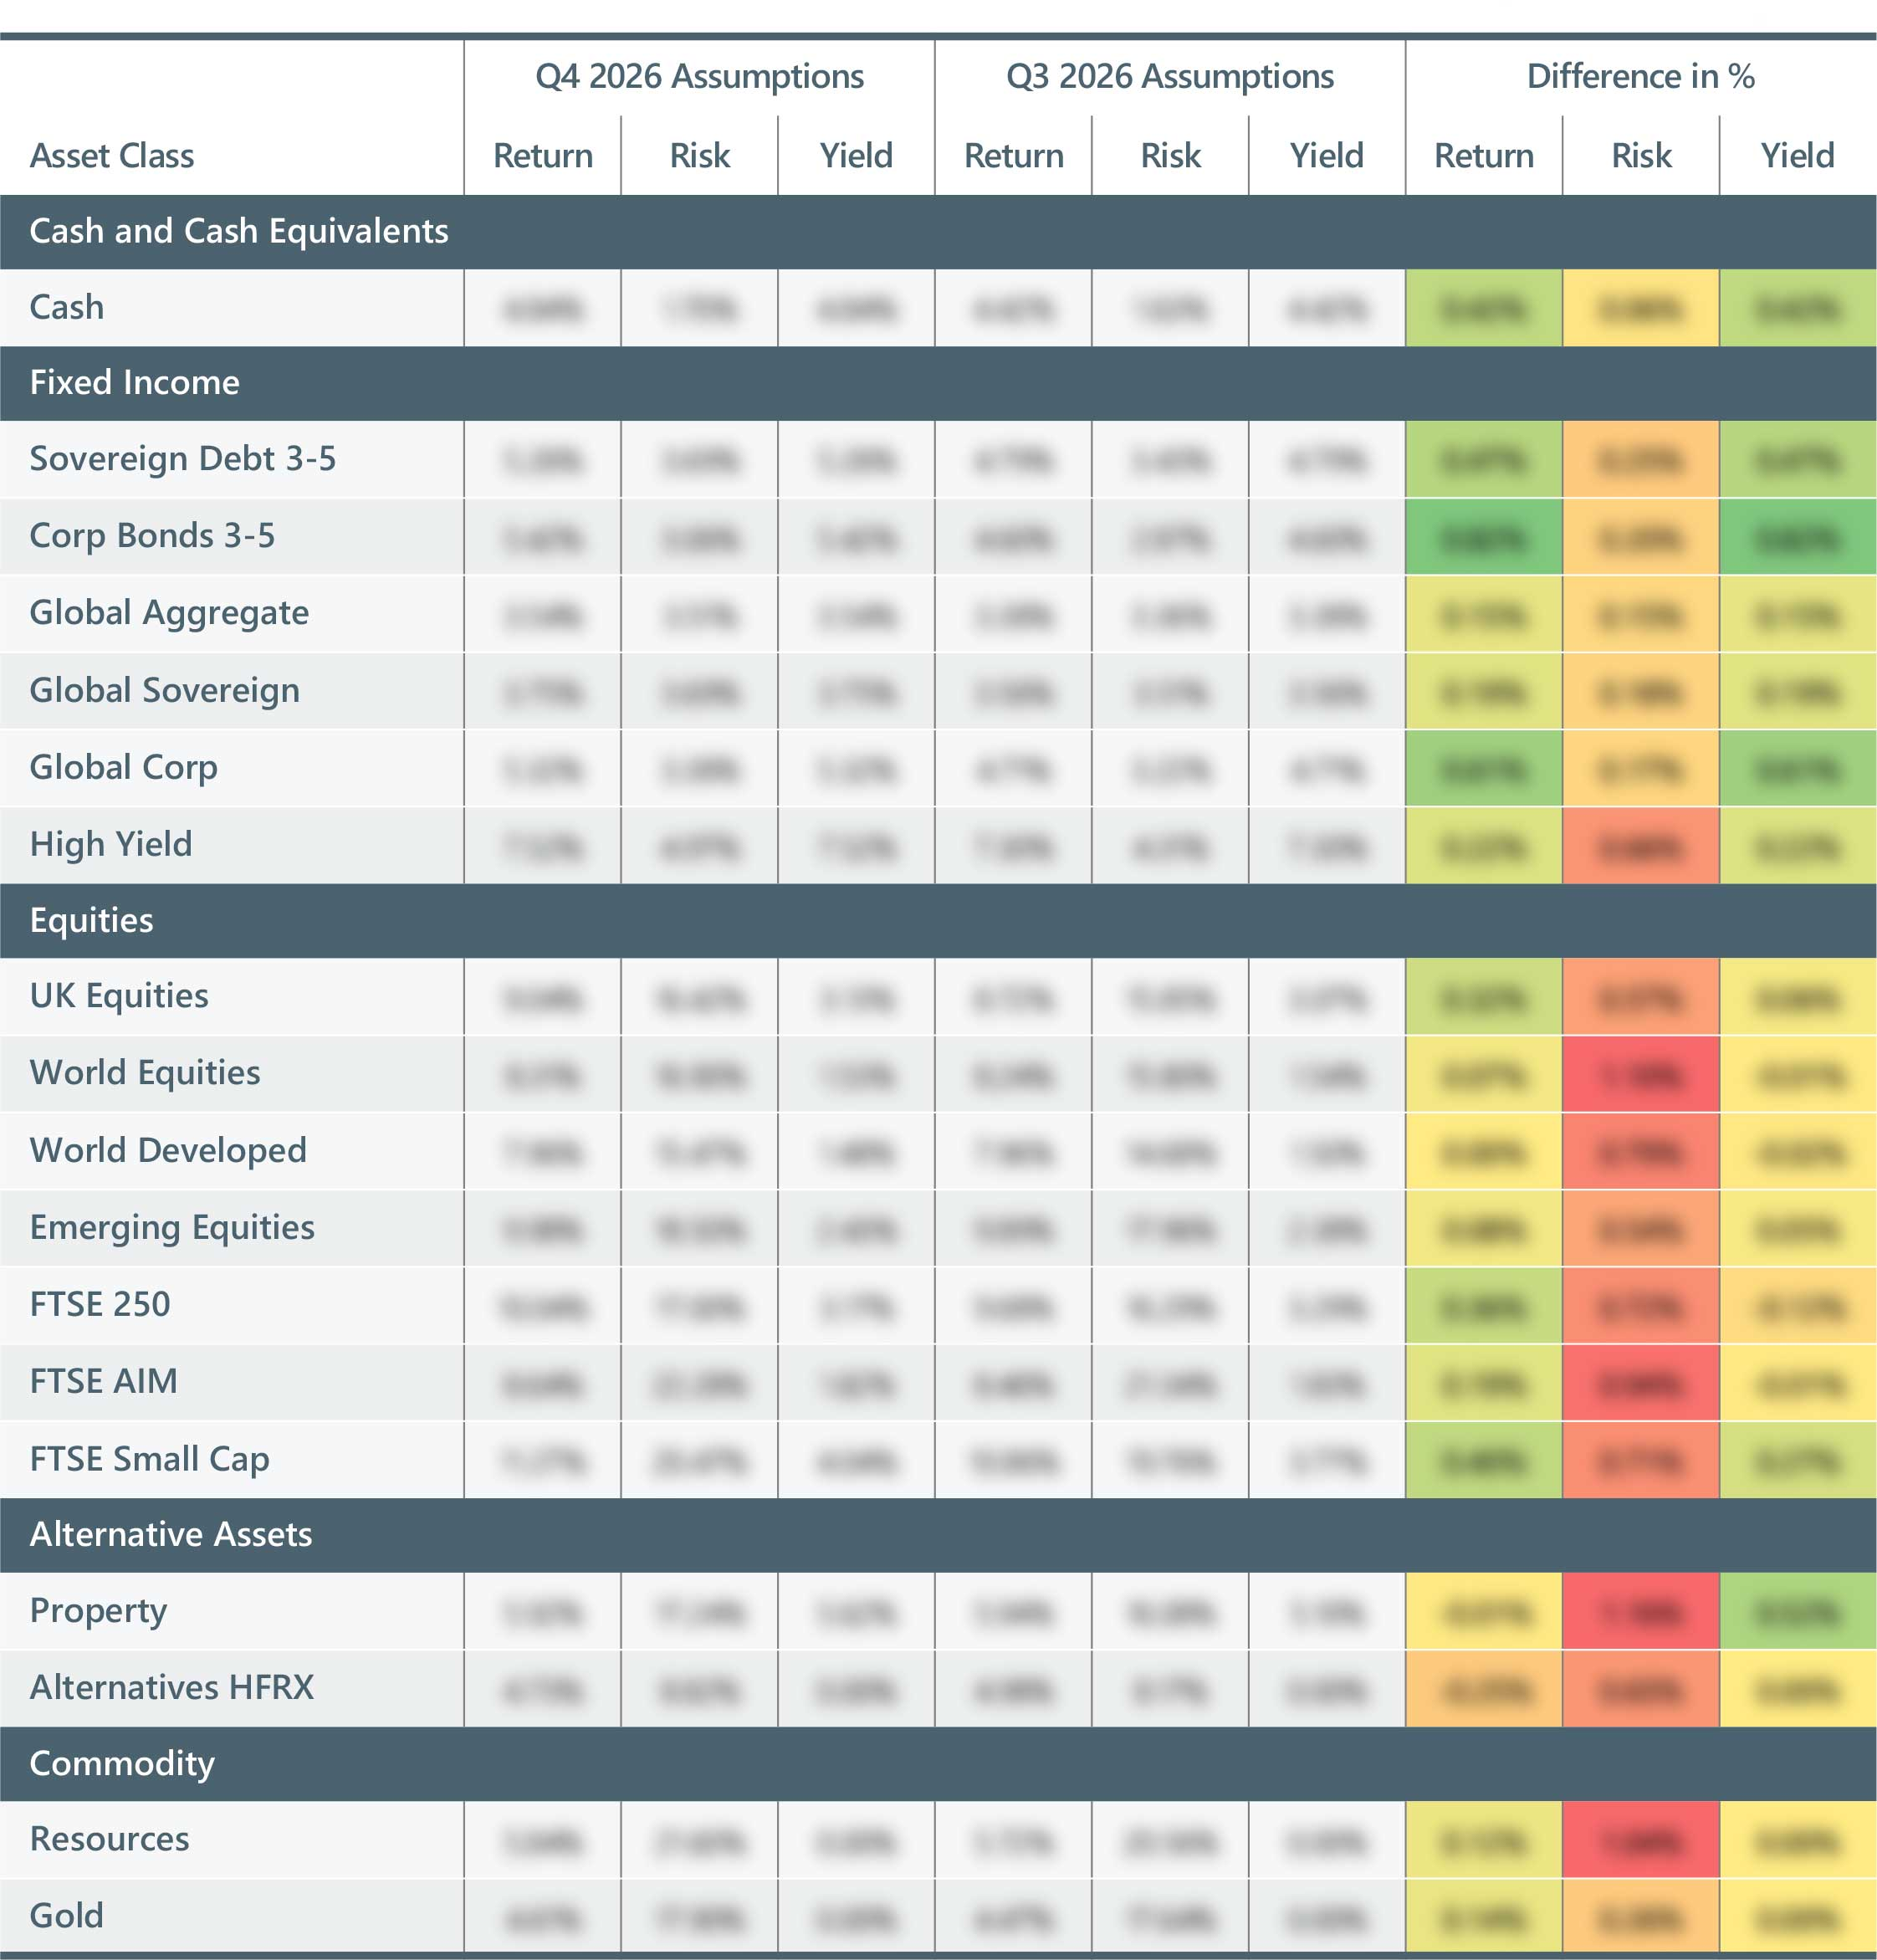
Asset class assumptions
Notes on returns and risks given in the table below
Calculation date: 9 October 2026
Assumptions: Nominal returns and risks
Risk horizon: 2 years
Return horizon: 8 years
Yield: Prevailing market rates as at calculation date
Inflation basis: UK market rates from the Bank of England at calculation date
Cycle basis: 50% Growth, 50% Overheat
Estimated position in the economic cycle
Further information
For further information on this document please contact

Managing Director
Dorey Financial Modelling
Office 1, Floor 4
2 Cornet Street
St Peter Port
Guernsey GY1 1BZ
Email: martyn.dorey@doreyltd.com
Direct: 01481 740560
Office: 01481 729044
Mobile: 07839 700717
Web: www.doreyltd.com

Associate Actuary
Dorey Financial Modelling
Unit 1
The Courtyard
Sturton Street
Cambridge, CB1 2SN
Email: Robert.Whitfield@doreyltd.com
Direct: 01481 740568
Office: 01481 729044
Mobile: 07792 851064
Web: www.doreyltd.com

Consultant
Dorey Financial Modelling
Office 1, Floor 4
2 Cornet Street
St Peter Port
Guernsey GY1 1BZ
Email: Bernadette.kerr@doreyltd.com
Office: 01481 729044
Web: www.doreyltd.com
Important notice
This document has been produced by Dorey Limited, trading as Dorey Financial Modelling. Dorey Financial Modelling does not give advice as to the purchase, sale, subscription for or underwriting of investments, or advice as to the exercise of rights conferred by investments. Dorey Financial Modelling does not perform any delegated investment functions across any of its clients.
Dorey Financial Modelling is not authorised and/or regulated in the United Kingdom by the Financial Conduct Authority (“FCA”) under the Financial Services and Markets Act 2000 or in the Island of Guernsey by the Guernsey Financial Services Commission (“GFSC”). Recipients should also note that they will not be able to bring any complaints about Dorey Financial Modelling to the FCA, the Financial Ombudsman Service or the GFSC or claim compensation from the Financial Services Compensation Scheme.
Certain countries and jurisdictions have restrictions imposed by law on the distribution of information, accordingly, the information that may be viewed is not directed at or intended to be acted upon by anyone in any jurisdiction where it would be unlawful to do so or in which Dorey Financial Modelling would be required to be authorised. It is the responsibility of the recipients to acquaint themselves with and to comply with the laws and regulations that apply to them.
No information given in this document constitutes a solicitation, offer or recommendation by anyone in any jurisdiction to provide any investment advice or services. Recipients confirm that they are eligible to view its content. If any Recipient is not eligible, they should not proceed to read this report. The information contained in this report, which does not purport to be comprehensive, has been compiled by Dorey Financial Modelling. References to specific companies or securities are illustrative of the themes discussed and are not recommendations to buy, sell or hold. Dorey Financial Modelling, its officers and employees may hold positions in, or have commercial relationships with, companies referred to in this document. No enquiry has been made of individual holdings, and no representation is given as to whether any such position exists.
While this information has been compiled in good faith, no representation or warranty, express or implied, is or will be made and no responsibility or liability is or will be accepted by Dorey Financial Modelling, or by any of its respective officers, employees or agents, in relation to the accuracy or completeness of the document or any other written or oral information made available to any interested party, or its advisers and any such liability is expressly disclaimed. In particular, but without prejudice to the generality of the foregoing, no representation or warranty is given as to the achievement or reasonableness of any future projections, estimates or prospects contained in the document or in such other written or oral information.
This document has been compiled and published by Dorey Financial Modelling. To the fullest extent legally permissible, no reproduction, copying, image scanning, storing, recording or (except as required by law) or modifying of the report by any means in any form nor broadcasting or transmission through any medium of any part of the report is permitted without Dorey Financial Modelling’s prior express written consent. All intellectual property rights that belong to Dorey Financial Modelling in respect of the Modelling work supporting this document are reserved.
These Terms are governed by and construed in accordance with the laws of the Island of Guernsey and Dorey Financial Modelling and all recipients hereby submit to the non-exclusive jurisdiction of the Courts of the Island of Guernsey.
By viewing this document, recipients agree to be bound by the foregoing Terms.
