Quarterly Outlook Q2 2025
14th April 2025
Markets on a knife edge | Q2 2025 update
The global economy is in flux, with geopolitical tensions and tariff-driven uncertainty weighing heavily on investor sentiment. In our latest market update, we break down what this means for UK, EU, US and global markets — and what to watch in the months ahead.
In our video Martyn Dorey, our Managing Director, provides a short summary.
Market snapshot: Q2 2025
Higher risk: Trump trade war puts the global economy at a knife edge
World leaders, businesses, central banks and traders are attempting to work in a shifting environment, which some business leaders have described as a “whiplash”. Equities are down overall, bond markets are mixed, and confidence in US Treasuries as a safe-haven appears to have diminished.

Macroeconomic outlook: diverging views to achieve dual mandate
It is not unusual at this stage of the economic cycle for the global economy to flip between moving forward to recovery or to flip back to contraction. However, such is the impact of US tariff policy that the economic cycle is potentially flipping backwards by two steps to potentially overheating and then back to recovery. If inflation is rising, the Federal Reserve (Fed) needs to increase interest rates; if unemployment is rising, the Fed needs to lower rates. When both are rising – a likely outcome of the tariffs – the central bank must prioritise one mandate over the other. The Fed is currently waiting to see how the US economy is responding to Trump’s volatile trade policy.
- Before the tariff announcements, markets priced in rate cuts of up to 1% in the US and 0.75% in the EU and UK. Markets are still pricing in cuts this year, but economists are expressing dissenting views on the likelihood of cuts – due to the expected inflationary effect of tariffs.
- The Fed paused interest rate cuts in Q1 2025. The current rate of 4.31% compares with 5.31% a year ago. The European Central Bank (ECB) cut rates by 25bps twice – the current rate is 2.65% vs. 4.50% a year ago – the Bank of England cut rates by 0.25% to 4.50% in February vs 5.25% April 2024.
- Federal Reserve Chairman, Jerome Powell, signalled the Central Bank will stand firm and patient to gauge the extent and projected impact of tariffs before adjusting the monetary policy position.
Regional markets
The UK market and European markets appear to be a strong value proposition now, and Starmer and other European leaders need to focus on being a safe pair of hands.
The US lack of commitment to NATO and Ukraine has led to a dramatic increase in valuations in European defense and engineering stocks.
Xi Jinping is positioning China as a stable global partner against the US and will be patient. Individual companies in China will likely work to circumvent or avoid the impact of tariffs.
Outlook – inflection point
- Investors are currently waiting to see whether Trump policies will lead to inflation or increasing unemployment. No one can predict this outcome at the current time, and the global economy is at an inflection point.
Inflection point
Markets are buffeted
Triggered by Trump’s capricious foreign policy, markets are experiencing wide swings across all asset classes. The economic cycle tells us that we have been here before.
Whilst the world blames one man – Donald Trump – for triggering this turmoil, the current stock market behaviour is not an unusual part of the economic cycle. For example, before a full economic recovery it is not unusual for the equity markets to flip-flop until a forward direction of travel is established. As a result, the markets are very sensitive to poor US economic policy, currently investors will swing between abject fear and exuberant over-confidence. For example, a similar time was after the financial crises of 2007, a revaluation of the US credit rating took place in August 2011, and the market’s response bears uncanny similarities to today, with Gold soaring in price as a safe harbour.
Low unemployment has been a feature of the post covid-19 global economy and increased interest rates have not led to the expected rise in unemployment that we would normally see. So the question is, will Trump create the unemployment that the US needs to temper persistent wage price pressures. What is hard to gauge is how the brand of America has been damaged, and the risk premiums for unpredictability and how a loss of trust in the US will persist beyond Trumps presidency.
Governments around the world will have to engage in policy interventions, such as fiscal stimulus or regulatory changes, to stabilise the economy and restore domestic investor confidence.
US Treasuries lose safe-haven status
Trump’s unpredictability leaves markets guessing
In times of market turmoil, funds would typically flow into safe-haven assets, such as US Treasuries –traditionally delivering relatively lower yields during market turmoil. This would strengthen the dollar (driven by demand) and push down yields. However, the opposite is happening. The extreme unpredictability of US policy and the uncertainty around impact, is undermining faith in the market’s ‘safest asset’ of US Treasuries, and US Treasuries are currently trading like a risky asset.
A rise in US Treasury yields could make rolling over US debt at higher interest rates a challenge as a third of the publicly held debt will be maturing in the next 12 months. The biggest holders of Treasury Bills (T Bills) are Japan, the UK and China and it is widely accepted that a fire-sale of T bills by these Governments will be self defeating, and none of these Governments will want to see treasuries tank. However, financial institutions have been unwinding futures positions, and this has been the biggest driver of the yield rises, and a weaker dollar.
There is an argument that the weaker dollar could help redress the trade balance, by making US exports more attractive on a cost basis. Additionally, since commodities are priced in dollars, a weaker dollar benefits foreign buyers by lowering their costs.
Nevertheless, if central banks diversify away from the dollar, the likely beneficiaries will be GBP, Euro, Yen and for many countries Gold will be considered the key reserve asset. We note that Gold has risen around 24% since the start of the year.
POTUS 2025
Midterms loom already
It is increasingly likely that Trump will lose the House of Representatives in the November 2026 midterm elections
Trump has been pursing an “everything, everywhere all at once” approach whilst he has Republican control of the House of Representatives (which sets the law), and the Senate (which ratifies the law from the House). However, the clock is ticking, as the market odds of the Democratics taking control of the house at the November 2026 midterms has risen sharply to 83%. If the odds are played out with Democrats controlling the house from November 2026 onwards the US Government is likely to move into stasis. Polls from YouGov give a sharp increase in disapproval in Trumps tariff policy as more Americans think corruption and inflation are more serious problems than the trade deficit.
We would note two departures from the traditional remit of the POTUS, which have the potential for destabilising the US and global economy:
- Trump asserting control of supposedly independent agencies, including politicising the military by overruling laws of appointment “in the national interest”. Is the independence of the US Federal Reserve at risk? It seems impossible, but so did many other things.
- Trump’s use of seemingly trivial topics to increase his control, for example his executive order to redefine ‘showerhead’, expanding permitted water flow per showerhead to flow per nozzle. First reactions relate to water conservation and the environment, as well as a power play for the sake of it. More seriously this is a strategic move to challenge the Administrative Procedure Act (APA) of 1946. The Administrative Procedure Act (APA) of 1946 is a US federal law that governs how administrative agencies create and enforce regulations. It was enacted to ensure fairness, transparency, and accountability in government decision-making. Trump’s “showerhead order” bypasses the APA’s “notice and comment” process, which is typically required for repealing regulations. Trump’s order states: “Notice and comment is unnecessary because I am ordering the repeal.” Critics argue that this could weaken judicial safeguards against executive overreach.
Beyond his legal and regulatory reach, Trump needs to shore up his support base. Currently there are three groups, with varying ideologies:
- MAGA voters – this cohort will vote for Trump no matter what.
- Prominent business personalities – many in this group backed Trump as the more likely candidate to help them increase their wealth, as opposed to any ideology. Doubt has crept in in this respect. For example, Bill Ackman posted that he had “assumed economic rationality would be paramount” in relation to the tariffs, he publicly stated that the world faced an “Economic Nuclear Winter” in response to the Tariffs.
- Normal Republic voters’ – overall confidence in Trump running the economy is decreasing.
Tariffs decrease overall welfare
Tariff economic primer
Because of the prominence of news flow we have included a brief primer on tariffs and trade elasticity.
Tariff impact will vary geographically and by product or service, depending on trade elasticities.
- Lost gains from trade: domestic consumption decreases
- Domestic production: wasted resources from higher-cost production, instead of focusing on efficiently producing according to comparative advantage.
- Government revenue: whilst this increases as government collects tariff revenues, this redistribution of welfare through doesn’t compensate for the inefficiencies caused. The administration burden of applying and managing tariffs will offset revenue collected.
Without tariffs

The yellow cross represents the quantity of a good or service (Q) demanded and supplied at a certain price (P). To demonstrate the impact of a tariff, the chart represents the domestic (DOM) supply and demand curves.
In a free market economy, the quantity demanded is equal to the quantity supplied; the equilibrium price is PEQ(DOM).
With free trade (FT), consumers access a lower price, demanding a higher quantity – QDDOM(FT). Domestic producers make less at this lower price – QSDOM(FT). Imports make up the difference in quantity demanded and supplied.
With tariffs

Applying tariffs increases the world price to PW+T. The increase in price will be borne by consumers and producers; the distribution of this will vary.
The magnitude of the changes in quantity supplied and demanded depends on price elasticity, represented by the slope of the supply and demand curves.
Exporters sell less due to lower consumer demand at higher prices. Higher prices encourage domestic producers to make more.
There is an overall “deadweight loss” of welfare to the economy (domestic and global), despite the government’s collection of tax revenue.
Trade elasticity
Elasticity: The invisible hand behind tariff impacts
The US has high export elasticity and is more vulnerable to reciprocal tariffs than most countries.
Elasticity measures how responsive the quantity demanded or supplied of a good is to changes in price or income. In simpler terms, it shows how much people buy or produce more (or less) of something when the price or their income changes. This may be due to substituting the good with an alternative, or simply foregoing buying/producing the good.
Elasticity varies geographically, as well as by sector, therefore the impact of the tariffs will depend on the elasticity of trade for each good or service, in each industry and country.
The implications of high and low export elasticity in a trade war are significant. The higher a country’s export elasticity, the more vulnerable they are to tariffs. Data from the World Bank puts the US as a vulnerable country to reciprocal tariffs, having high export elasticity and large levels of GDP.
When export elasticity is high, foreign demand for a country’s goods is very sensitive to price changes. Impacts include loss of market share, and short-term economic losses. Governments may need to provide subsidies or incentives to support exporters in remaining competitive globally.
When export elasticity is low, foreign demand for a country’s goods is less sensitive to price changes. Even with higher prices due to tariffs, foreign buyers may continue purchasing these goods, especially if they are essential or have few substitutes, for example specialised machinery and rare resources. Countries with low export elasticity may face smaller immediate losses in export volumes, as their goods are harder to replace.
In industries where there are high barriers to entry, supply will be less elastic (more inelastic). High startup costs, government regulations, patent and other intellectual property protections, as well as dominance and strong competition from established firms, will make it difficult for new suppliers to enter the market.
The chart below illustrates that the US has amongst the highest export elasticity, and pre-empting a tariff war is akin to throwing stones in a glasshouse.

Making America great (again)?
US consumers will be worse off, particularly in the short term but the impact of the tariffs will depend on supply elasticity, and the availability of substitutes for increasingly expensive imports.
Impact on domestic producers operating in industries with import tariffs

The higher-ranked sectors (near 1) exhibit lower elasticity, meaning consumers are less likely to substitute domestic goods for imports, and visa versa. These sectors tend to be more specialised, differentiated, or technologically advanced, making foreign and domestic products less interchangeable.
In contrast, lower-ranked sectors (higher numbers) have higher elasticity, indicating that domestic producers benefit more from tariff increases. However, they are also more effected by reciprocal tariffs and will be targeted by non-US policy makers in retaliatory actions.
These “red” goods are generally more commoditised, lead consumers and businesses to easily switch between domestic and imported alternatives.
It suggests that pharmaceuticals and aerospace/defense goods have lower elasticity, indicating that consumers and businesses prefer specific producers and don’t readily switch in response to price changes.
Commodities and basic metals have higher elasticity, meaning they are more substitutable, and exports are likely to suffer.
Most of Trumps voter base is in the US rust belt working in Agricultural industries, and these groups will be significantly impacted by a drop in international demand caused by reciprocal tariffs.
Based on information presented in: A Comparison of Sectoral Armington Elasticity Estimates in the Trade Literature. Journal of International Commerce and Economics, May 2021
This ranking is based on sector-level comparisons across multiple studies, rather than absolute elasticity values. This is because numerical estimates of elasticities across studies vary due to differences in methodology, data, and sectoral aggregation. Despite this, there appears to be consistency in the relative ranking of elasticities across industries. Even though individual elasticity estimates might vary across studies (sometimes significantly), the hierarchy of substitutability tends to remain stable across methodologies.
Market assumption approach
Approach
The principle is to consider typical eight-year returns based on where we are in the economic cycle.
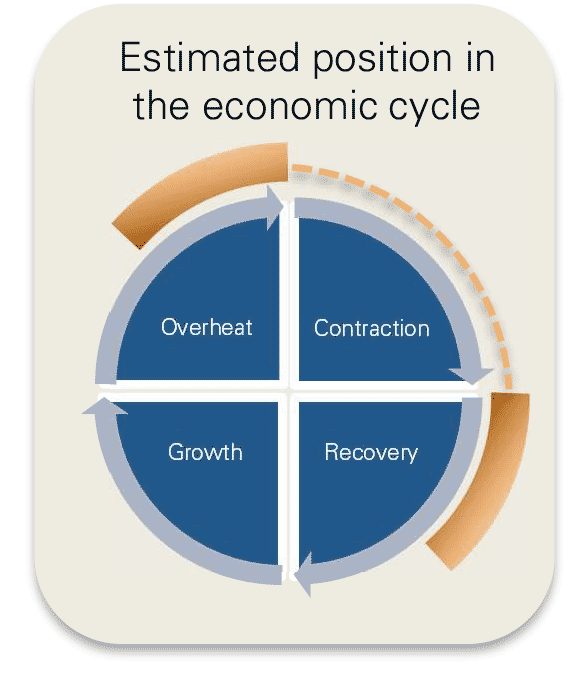
A classical view of the economic cycle is that the economy moves through four stages, growth; economic overheat, requiring intervention from central banks to temper inflation; contraction requiring economic stimulus to get the economy back on its feet; and then recovery as stimulus is scaled back. In real-life the economy can move backwards or skip a stage compared to this simplified representation.
Market returns can also be impacted by events that fall outside of this cyclical macro-economic behaviour. Covid-19 was one such example which led to the global economy cycling very quickly through contraction and back into overheat.
Whilst stock market crashes are possible at all stages of the economic cycle, they are more likely to be deeper and felt wider across the economy when the cycle moves from overheat into contraction.
Position in the economic cycle
Based on the current conditions in markets and the global economy, largely driven by the US, we have weighted our analysis as 25% contraction and 75% recovery.
Estimating returns
The return for cash is the SONIA overnight rate for cash expressed as an annualised return.
For assets in the Fixed Income asset classes, we used the latest eight-year yield to maturity as the annualised return for each of the sub-asset classes. This is to avoid any arbitrage opportunities within the market return estimates.
For Equities and remaining asset classes, our market data from 1971 is partitioned into four economic stages – Growth, Overheat, Contraction and Recovery. Then we have calculated annualised risk and return for each index over rolling two-year and eight-year periods. The analysis is done net of UK inflation. We have then added back in current expectations of eight-year UK inflation to give a return expectation based on current inflation expectations and a probabilistic weighting of where we are in the economic cycle.
Manual adjustments to reflect efficient market pricing
Some risky asset classes do not fit on a neat risk return spectrum, such as the FTSE All-Share AIM historical risk, and Emerging Market historical returns. For example, FTSE AIM exhibits moderate volatility and very poor historical downside events. Conversely, Emerging Markets has high volatility but low historical returns. For parity we adjusted FTSE AIM risk upwards in line with observed downside performance. The Emerging Market equity returns were adjusted upwards to be in line with a capital asset pricing model (CAPM), in essence this means that an investor would expect to be compensated with more return for taking on more risk in Emerging Market equities.
Asset class assumptions
Notes on returns and risks given in the table below*
Calculation date: 9th April 2025
Assumptions: Nominal returns and risks
Risk horizon: 2 years
Return horizon: 8 years
Yield: Prevailing market rates as at calculation date
Inflation basis: UK market rates from the Bank of England at calculation date
Cycle basis: 50% Overheat; 50% Recovery

* Data has been redacted, please contact us for further information.
Further information
For further information on this document please contact us

Managing Director
Dorey Financial Modelling
Office 1, Floor 4
2 Cornet Street
St Peter Port, GY1 1BZ
Email: martyn.dorey@doreyltd.com
Direct: 01481 740560
Office: 01481 729044
Mobile: 07839 700717
Web: www.doreyltd.com

Trainee Actuary
Dorey Financial Modelling
First Floor, Suite 10,
The New Mill House,
Chesterton Mill, French’s Road,
Cambridge CB4 3NP
Email: Robert.Whitfield@doreyltd.com
Direct:01481 740568
Office: 01481 729044
Mobile: 07792 851064
Web: www.doreyltd.com

Consultant
Dorey Financial Modelling
Office 1, Floor 4
2 Cornet Street
St Peter Port, GY1 1BZ
Email: Bernadette.kerr@doreyltd.com
Office: 01481 729044
Web: www.doreyltd.com
Important notice
This document has been produced by Dorey Limited, trading as Dorey Financial Modelling. Dorey Financial Modelling does not give advice as to the purchase, sale, subscription for or underwriting of investments, or advice as to the exercise of rights conferred by investments. Dorey Financial Modelling does not perform any delegated investment functions across any of its clients.
Dorey Financial Modelling is not authorised and/or regulated in the United Kingdom by the Financial Conduct Authority (“FCA”) under the Financial Services and Markets Act 2000 or in the Island of Guernsey by the Guernsey Financial Services Commission (“GFSC”). Recipients should also note that they will not be able to bring any complaints about Dorey Financial Modelling to the FCA, the Financial Ombudsman Service or the GFSC or claim compensation from the Financial Services Compensation Scheme.
Certain countries and jurisdictions have restrictions imposed by law on the distribution of information, accordingly, the information that may be viewed is not directed at or intended to be acted upon by anyone in any jurisdiction where it would be unlawful to do so or in which Dorey Financial Modelling would be required to be authorised. It is the responsibility of the recipients to acquaint themselves with and to comply with the laws and regulations that apply to them.
No information given in this document constitutes a solicitation, offer or recommendation by anyone in any jurisdiction to provide any investment advice or services. recipients confirm that they are eligible to view its content. If any Recipient is not eligible, they should not proceed to read this report. The information contained in this report, which does not purport to be comprehensive, has been compiled by Dorey Financial Modelling.
While this information has been compiled in good faith, no representation or warranty, express or implied, is or will be made and no responsibility or liability is or will be accepted by Dorey Financial Modelling, or by any of its respective officers, employees or agents, in relation to the accuracy or completeness of the document or any other written or oral information made available to any interested party, or its advisers and any such liability is expressly disclaimed. In particular, but without prejudice to the generality of the foregoing, no representation or warranty is given as to the achievement or reasonableness of any future projections, estimates or prospects contained in the document or in such other written or oral information.
This document has been compiled and published by Dorey Financial Modelling. To the fullest extent legally permissible, no reproduction, copying, image scanning, storing, recording or (except as required by law) or modifying of the report by any means in any form nor broadcasting or transmission through any medium of any part of the report is permitted without Dorey Financial Modelling’s prior express written consent. All intellectual property rights that belong to Dorey Financial Modelling in respect of the Modelling work supporting this document are reserved.
These Terms are governed by and construed in accordance with the laws of the Island of Guernsey and Dorey Financial Modelling and all recipients hereby submit to the non-exclusive jurisdiction of the Courts of the Island of Guernsey.
By viewing this document, recipients agree to be bound by the foregoing Terms.

