
Market Update Q3 2026
24th August 2026
Market snapshot: Q3 2026
Markets continue their ascent, but volatility is increasing
Markets are continuing to take a long view of current geopolitical shocks, with attention focused on earnings. The June SpaceX listing captured a euphoric mood when investor enthusiasm briefly outran fundamentals, although subsequent corrections suggest a return to greater sobriety. There are a lot of macro economic forces pushing up inflation, so we discuss key forces which are climate-related and geopolitical risks in this market update. Volatility remains concentrated in themes such as AI, defence and space. Unusually, the low-technology composition of the FTSE All-Share has made the UK market a useful source of diversification.
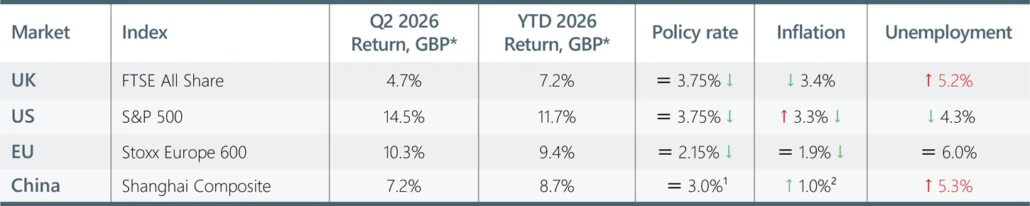
Movements relative to previous quarterly update.
* Returns above are calculated from the GBP total return index of each index
Macroeconomic outlook: Oil shocks and lower demand for labour
The volatile on-off US–Iran war and Russia’s war in Ukraine are disrupting energy flows. Higher oil and import costs are lifting inflation, and higher bond yields weaken growth. Policymakers face a trade-off: purchasing power is falling, but central banks want evidence on inflation, wages and activity before increasing rates.
- Inflation – Earlier inflation shocks have been absorbed, but inflation is rising again in the U.S. and EU, while UK inflation remains steady.
- Employment – Labour demand has cooled. US hiring slowed, and euro-area unemployment remains low. UK payrolls fell by 65,000 and vacancies are at their lowest since 2021. More concerning is youth detachment: 1.01 million 16–24-year-olds, or 13.5%, were not in employment, education or training, the first total above one million since 2013.
- Interest rates – Most central banks held rates, but the ECB raised them and further tightening is expected. Central banks are more likely to delay cuts than raise sharply unless wage and services inflation reaccelerates.
UK markets
The UK market remains strong, led by energy, materials, financials and high-dividend defensives. The UK market has low exposure to highly valued technology stocks, which meant the FTSE All-Share was a useful source of diversification during volatility in AI-led markets. Prime Minister Andy Burnham’s plans for housing, infrastructure and regional industry have been warmly received by industry.
Outlook – Heat and conflict
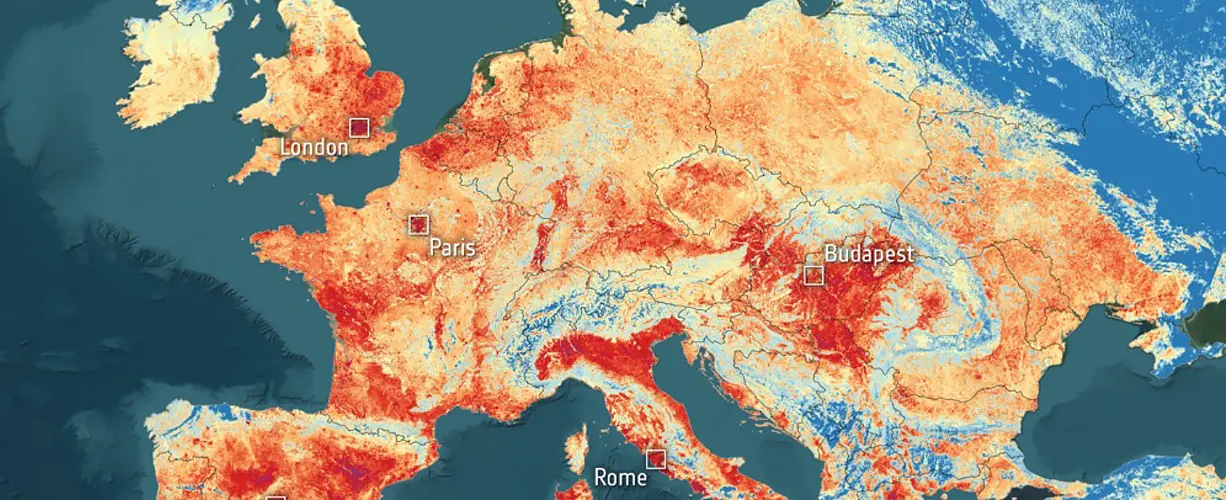
- Climate action is intertwined with democratic values – Record heat across Europe and the US is exposing weaknesses in government policy, and democratic systems too. For example, free reporting has become more concentrated into billionaire hands. Take Vincent Bolloré, in France, whose Vivendi empire has openly eased the French National Rally into the mainstream ahead of the wide-open 2027 French presidential election. Counterintuitively, heatwaves and fires aren’t pushing European nationalist parties toward climate action; instead, extreme heat is being positioned as the “new ordinary” making a case that we should move towards lower carbon but adapt to heat with lower living costs rather than pursue the expensive net zero option. Only repeated severe seasons are likely to move National parties towards a Green Deal, and even then, toward resilience, rather than an “Earth Recovery plan” that honest appraisal requires.
- The nature of war is impacting the nature of investment – defence investment continues as a theme this year. KNDS, the German state-backed Leopard 2 tank maker, postponed its ~€15bn IPO in July 2026 – the old-school model of heavy defence platforms was not favoured by investors for a public listing. Instead, new-school capital ran the other way: Aztec Group administered Lakestar’s oversubscribed ~$300m Resilience I fund for dual-use defence tech, its founder Klaus Hommels, the VC behind Spotify and Revolut, arguing “Europe needs sovereign technology capital.” Defence-tech startups raised about $12.3bn in the first half of 2026, already topping all of 2025, though the flows stay overwhelmingly American. The outlook is robust and maturing: budgets keep rising toward NATO’s 5% goal but slowly, and capital concentrates on a few proven winners in defence AI.
Investment notes
Markets favour momentum and resilience
AI and earnings still support sentiment, while heat, conflict and power shortages are increasing the value of continuity and diversified regional supply-chain exposure.
Risk assets
- Equities remain resilient, and not cheap – AI infrastructure, defence, utilities and financials are attracting capital.
- Leadership is narrower – earnings visibility, pricing power and strategic relevance matter more than broad market beta.
- Risk – Markets are treating interruptions as temporary, while physical bottlenecks are becoming more frequent.
Commodities and real assets
- Energy supply – Hormuz and Russia-related disruption are keeping oil and gas risk premia elevated, with diplomatic headlines driving sharp but fragile price reversals.
- Broader commodity pressure – Heat, water stress and disrupted trade routes are increasing volatility across industrial metals, fertiliser and agricultural inputs, with effects extending beyond energy markets.
- Resilience infrastructure – Power, grids, water, transport and storage assets have a clearer investment role as reliability and operating continuity become services customers are willing to pay for.
- Risk – Gold, defence and AI-linked infrastructure remain heavily owned, increasing the risk of sharp reversals when investors raise cash or sentiment shifts.
Rates and bonds
- Cuts stopped and EU hikes – The ECB raised in June and the Fed has been on hold since. Central banks can absorb a one-off energy shock, but not second-round wage or expectations effects.
- Long duration vulnerable – it remains exposed to fiscal risk and inflation uncertainty.
- Credit selection matters more – refinancing risk and cash-flow quality are more important than headline yield.
Regional and policy lens
- US policy – Earnings are still carrying the market, but fiscal drift and doubts over Fed independence keep dollar and rate risk elevated. As a result, Treasury yields have increased.
- UK credibility test – Burnham’s regional agenda may lift investment, but gilts and sterling will test fiscal discipline.
- Europe scale challenge – Defence, energy and industrial policy play to engineering strengths; fragmented markets limit scale.
- China EV growth – Exports surge, domestic demand weaker; US–China summit left EV tariffs and technology barriers intact.
- Asia AI – Taiwanese foundries and Korean memory makers lead returns; share prices exposed to drop in AI spending.
- India gains strategic weight – UK and EU trade agreements expand access as global trade shifts toward new partnerships.
- EMs diverge – Energy importers face inflation and currency strain; commodity exporters and tech-linked economies are better placed.
Hormuz: truce without trust
Oil markets remain highly sensitive to Trump administration announcements, but contradictory claims and rapid reversals have left markets looking to ship movements and insurance for evidence of progress.
Conditions for de-escalation
- US asks – Safe passage through Hormuz, an end to attacks on shipping and tighter limits on Iran’s nuclear and regional activity.
- Iran asks – Sanctions relief, security guarantees and recognition of its leverage over Gulf security.
- Global support – Allies back reopening Hormuz, but not Trump’s wider campaign; most favour mediation or defensive support over joining US strikes.
- Polymarket – The odds of Hormuz normalisation by end-August have collapsed to 1%, and year-end sits at 43%. But an Iran–Oman management agreement by September prices at 61% and Iran charging transit fees by year-end at 47%: the market expects a negotiated reopening with a toll. A US invasion before 2027 trades at 16.5%, below April’s peak. Overall, markets suggest that the US/Iran war has led to a longer-term worsening of trade through the Strait of Hormuz.
Market indicators to watch
- Shipping flows – Sustained tanker movements and falling war-risk premiums are the clearest evidence of improvement.
- Oil pricing – A narrowing premium for near-term delivery signalling easing supply pressure.
- Force build-up – More refuelling aircraft, bombers, air defences, mine-countermeasure assets signal preparation for sustained operations or forced Hormuz reopening.
- Second chokepoint – The East-West pipeline to Yanbu, Saudi Arabia’s 7m barrel-a-day Hormuz bypass, has already been hit by a drone attack, and tankers have been attacked in the Red Sea. Further strikes would weaken the bypass around Hormuz and widen the shock.
Heatwave: the infrastructure challenge
A global recovery plan?
At the start of 2026, the Institute and Faculty of Actuaries and the University of Exeter warned that institutions may be using climate assumptions that are too benign. Climate sensitivity could be nearer 4°C rather than the IPCC central estimate of 3°C, putting earth on the 83rd percentile of projections.
Five economic impacts to watch from the 2026 heatwaves
- Power – higher demand, combined with lower output. Cooling demands rose as heat reduced the output of nuclear, gas, hydro and wind generation across Europe and the US. German day-ahead electricity reached €210/MWh on 23 June, French nuclear output was cut by more than 9GW across 12 reactors, and Britain issued its first summer electricity-margin notice. By late July, low water on the Danube had forced both reactors at Romania’s Cernavodă plant offline; together they normally supply around one-fifth of the country’s electricity. Austrian utility Verbund estimated that poor hydrology reduced first-half earnings by €370m, while EDF expects 2026 EBITDA to fall by 10%, citing low prices and heat-related constraints on nuclear and hydro output. Investor capital is required for stronger grids, storage, reserve generation and plant cooling to preserve existing capacity. Then there is the political challenge to build new capacity to power energy-intensive data centres.
- Freight – falling river levels reduce industrial capacity. Cargo vessels on the Rhine were often sailing at around 20% of normal capacity to avoid grounding. Thyssenkrupp reduced blast-furnace production at Duisburg after raw-material deliveries were disrupted and suspended its own barge operations. On the Danube, grain barges were left idle and several ports became inaccessible. Freight between Rotterdam and the Rhine was running about 10% below normal by the end of July. Smaller loads require more journeys or a switch to road and rail, raising freight rates, fuel use and inventory requirements. These effects pass quickly into the price of fuel, chemicals, metals, grain and manufactured goods. Looking to the US – Mississippi freight – Lower river levels have already cut tow sizes by 13%; although the Memphis gauge should remain above its low-water threshold over August, St Louis barge rates could rise from $26 a ton towards the $53 seen in 2023—or $106 if the low waters of 2022 repeat, with September and October the key months if rainfall remains weak.
- Food – heat and drought are now affecting crop forecasts and traded prices. Britain’s wheat harvest was 54% complete by 27 July, with yields averaging 6.8 tonnes per hectare, 14% below the ten-year average. France’s maize crop may be its smallest in 50 years. Coceral cut its forecast for EU production by nearly 8% to 52.7m tonnes, the lowest since 2007. Looking globally: wheat prices have risen by about 20% since the start of the year on drought concerns in the United States, while rice prices at Southeast Asian export hubs rose by around 15% in a month as El Niño developed. JPMorgan estimates that El Niño combined with higher energy, fertiliser and packaging costs could add 0.3 percentage points to global inflation next year. Emerging markets are more exposed because food carries a larger weight in consumer spending and agriculture accounts for more employment and output.
- Labour and health – fewer hours were available for productive work. Spain allowed working hours to be reduced or shifted during severe heat alerts, while Barcelona equipped 1,400 outdoor workers with monitors requiring them to stop when body temperatures became unsafe. More than 10,000 excess deaths were recorded across Europe during the late-June heatwave, with over 9,000 among people aged 65 or above. Germany estimates that each day above 30°C costs its economy €430m in lost productivity. Employers face lower output, changed shift patterns, more sickness absence and higher cooling costs. In addition, governments face additional healthcare and income-support expenditure.
- Insurance and public finances – less cover, higher premiums. Wildfires forced about 220,000 people to evacuate in France and 100,000 in Spain. In the French camping sector, 62 sites were evacuated and cancellations extended into August, which normally accounts for around 40% of annual revenue. Swiss Re noted that national insurance pools in southern Europe often exclude wildfire losses and that global insured wildfire losses have risen by around 12% a year in real terms since 1970. Climate change made the fire weather twice as likely in south-western France and 20 times as likely in central Spain. Higher premiums, narrower cover and greater spending on firefighting, water, forest management and reconstruction transfer more risk to households, lenders and governments. More focus on land management and unpopular “firebreak burning” will be required in European and UK national parks to reduce the biomass of dry-tinder.
The economic cost of the Russia-Ukraine war
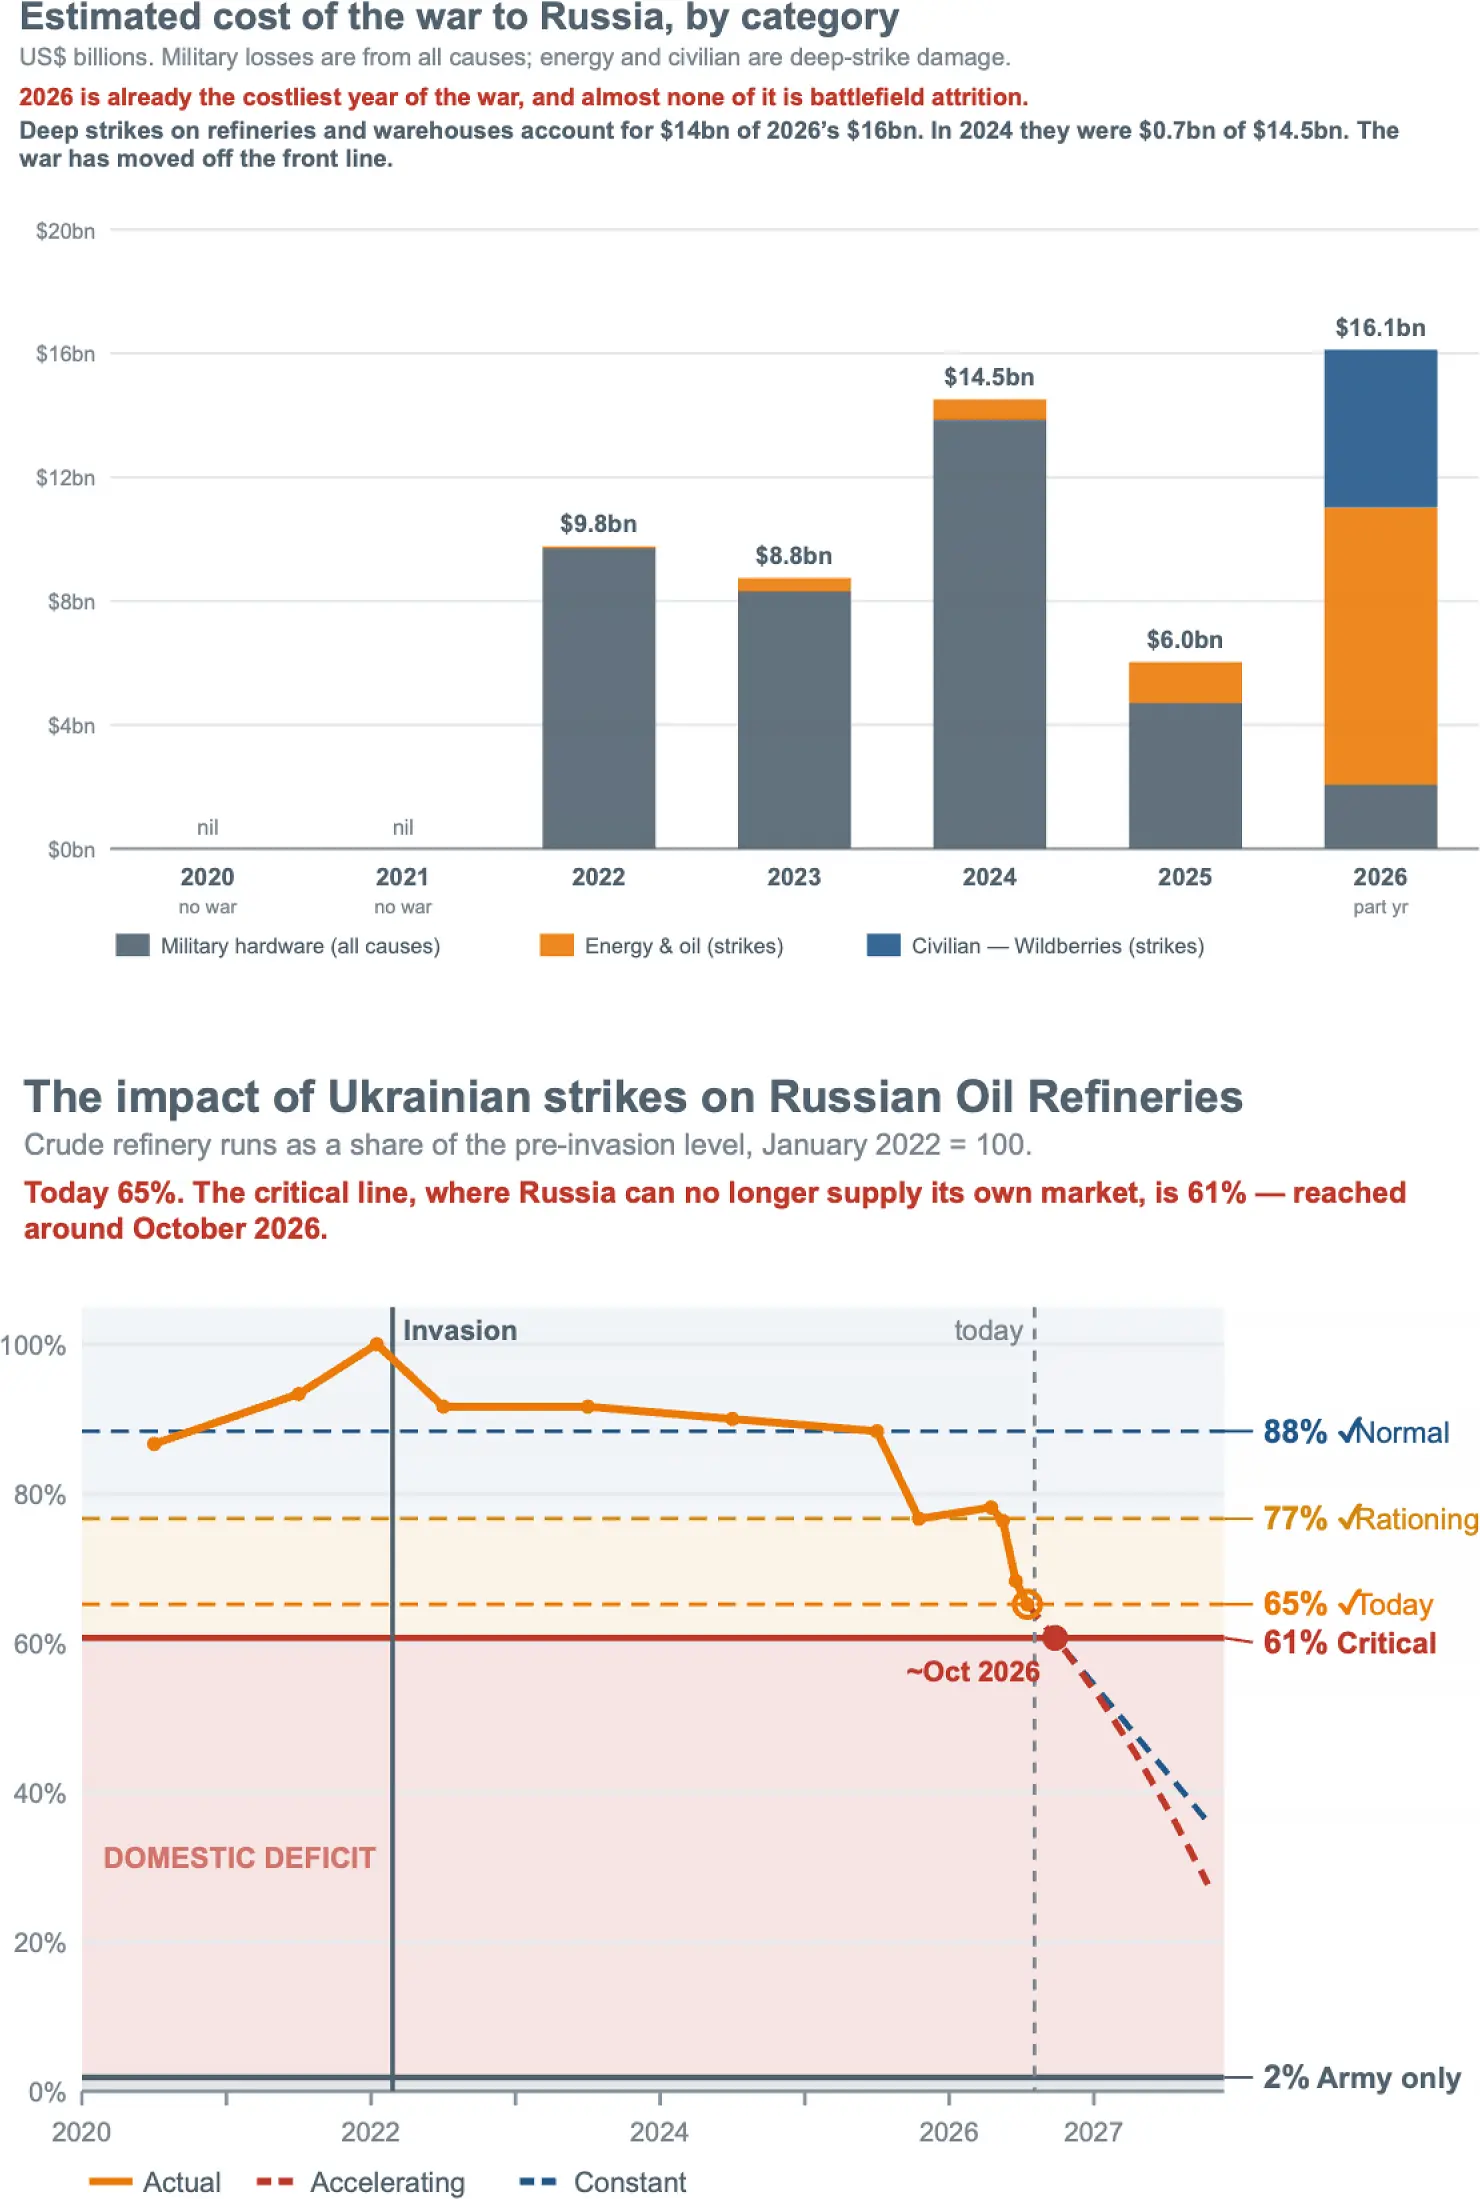 The global cost of living is being heated by the Russia-Ukraine war. Recent oil price shocks have strengthened Russia’s capacity to finance the war. However, indicators suggest that Russia is not as comfortable as headline crude revenues would suggest. Eyes are on inflation, which could rise significantly in the Russian state over the next 12 months.
- 2026 will be a record year for economic cost to Russia – Secure publicly available data demonstrates that strikes on Russia have moved from military hardware to targeting the economy of Russia. Twenty-one Wildberries warehouses were hit between 18 July and 16 August, as far east as Yekaterinburg, destroying nearly a third of its storage capacity. Damage in 2026 nears $16bn against $14.5bn in 2024; the year is on target to exceed $25bn. Zelensky says Wildberries centres supply the army with drone components, FPV drones and body armour marketed as “tested in the SVO”.
- The slow-moving front-line is trending to a halt with record Russian infantry casualties of 1,130 infantry per square kilometre. In the Russian rear, attacks on tanks have turned to attacks on trucks, with a record 14,000 truck losses in July, making front-line logistics unsustainable.
- Russian ballistic missiles have proved effective at penetrating Kiev’s defences, and the Kremlin will be concerned that Kiev will be deploying its own domestic ballistic missiles (FP-9) over the coming quarter. We would expect to see symbolic hits on the Russian state, data centres, and increased activity to prevent Russia deploying a domestic Star-Link service.
- Refined oil domestic crunch – As a result of refinery strikes, Russia could cross a key threshold over the coming quarter. Based on civilian demand for refined oil, Russia may not be able to satisfy domestic demand, even allowing for refined oil from Belarus imports. Russia will need to significantly grow imports to avoid a domestic energy collapse in 2027.
- Fiscally weak, not insolvent. Russia will not go bankrupt: debt is under a fifth of GDP and almost all of it is in domestic roubles. However, after four failed auctions, the Russian finance ministry stopped trying to issue new debt in July.
- Budget revenues are materially below target. Sergey Aleksashenko, former Deputy Chairman of the Bank of Russia and former Deputy Finance Minister, set out in February that “oil and gas tax rates are the product of the export oil price and the rouble–dollar exchange rate”. In July Urals recovered to $60.22 per barrel, just above the Kremlin $59 the budget, but because of a weak rouble each barrel earned 4,757 roubles instead of 5,440. As a result, oil and gas revenue for January to July came in at 4.60trn roubles a 12% shortfall below budget.
- Oil no longer funds the war. The Stockholm International Peace Research Institute (SIPRI), a gold standard on military spending, reports that Russian national defence spending of 12.9trn roubles exceeds all planned oil and gas revenue of 8.9trn, which means that military costs of 14.9trn are increasing towards double the cost of oil revenues. The gap is met by VAT, borrowing and the wealth fund, as a result, soon, Russian citizens will be feeling the cost of the war in their shopping baskets.
The economic doors keeping the Kremlin solvent
Doors that won’t shut
Somewhere in Ukraine there will be a map that sets out the key maritime doors for Russia’s oil exports shown as circles on the right. So far, the record shows that Kyiv has had mixed results in closing these doors. Ukraine has struck Primorsk and Ust-Luga repeatedly since September 2025, five times in ten days in March 2026, and halted operations in Novorossiysk in July. In the deepest week, to 29 March, Russian crude flows fell from 4.07m to 2.32m barrels a day and weekly export earnings from $2.45bn to $1.44bn. Then, shortly afterwards the ports reopened, and June brought Russia a wartime record of 4.4m barrels a day.
There are several issues for Ukraine to overcome in closing these economic doors, which are set out below.
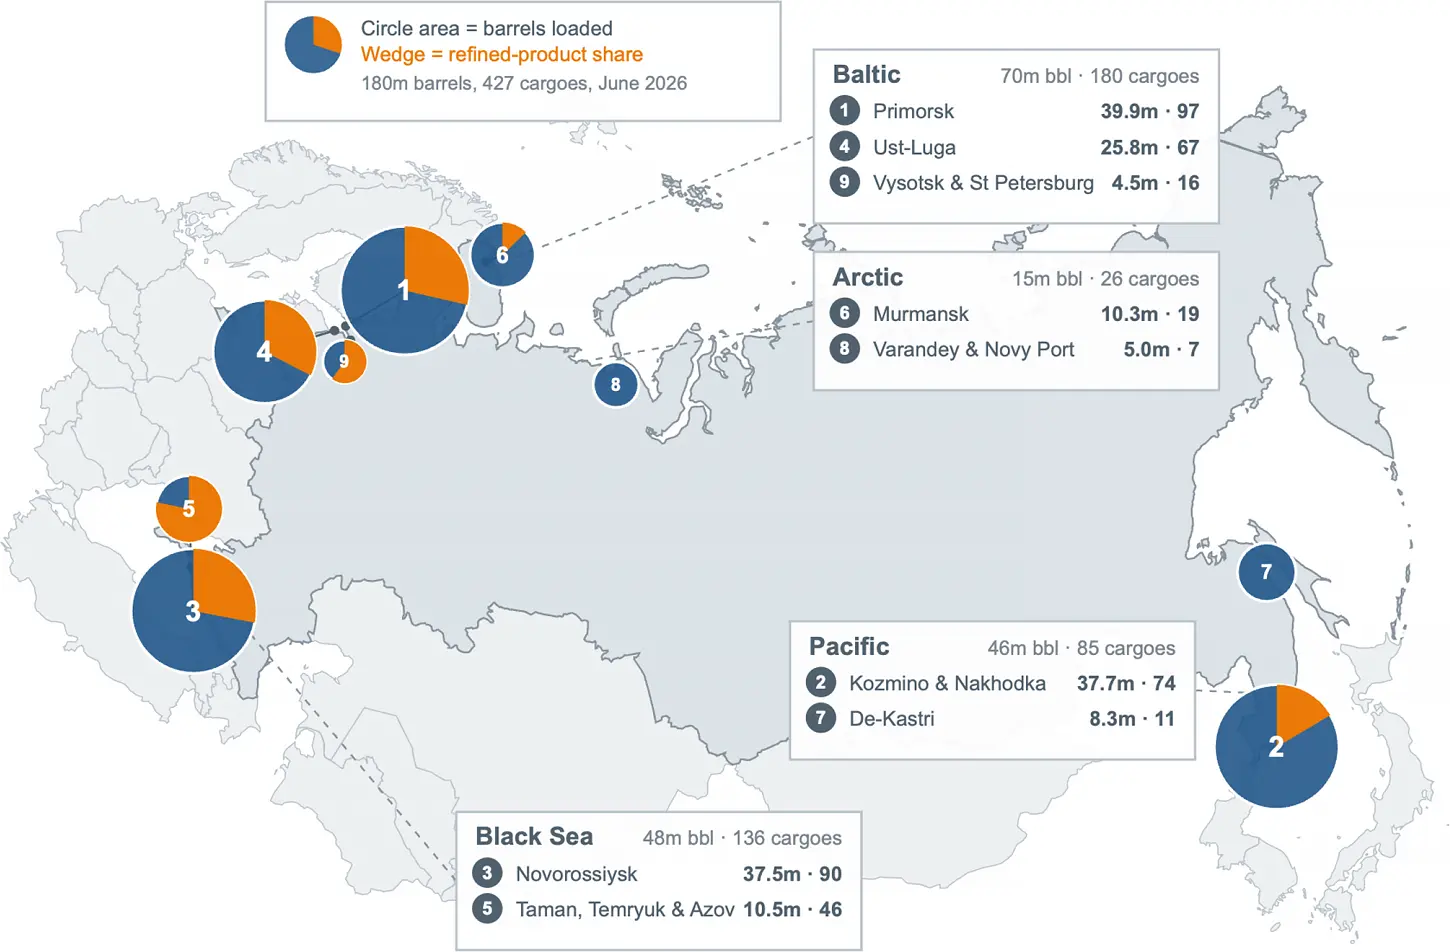
- Ukrainian drones carry small warheads, enough to burn a storage tank, but not enough to destroy a berth or a pump hall. A successful multi-faceted drone strike on the port of Novorossiysk points to work on an expanded strike configuration using the Sea Baby, which carries 2,000kg, and probably development on a submerged variant built for port targets. Ukraine now has the means to attack berths and subsea lines. How it can deploy these tactics into the Baltic, where the political cost to the Kremlin is highest, is an open question. Currently, Ukraine can reach only two of the maritime doors. And as a result, Russian oil is being routed to the east and north. Murmansk could be particularly vulnerable as this Arctic port rests on two floating storage units.
- Ukraine’s current strike strategy is to take down profitable refined crude product revenue by striking refineries which produce ‘product’. Russian product exports hit a record low of 4.7m tonnes in July 2026, less than half of July 2025, and Russia imposed its own diesel export ban. Now after a year of working on an effective refinery strategy, Ukraine reports Russian refining capacity as down 43%. However, crude is mostly flowing, and so far, Ukraine’s most effective single interdiction on crude was an inland strike near Brody, which halted the Druzhba pipeline for 86 days.
- Russia’s shadow fleet is critical for keeping the economic door open and is seeing increased strikes. Nine named tankers were struck between November 2025 and June 2026, off Turkey, between Crete and Malta, near Dakar. A tanker on an export voyage is soft, isolated and far from Russian air defence. There is also an unattributed sabotage campaign: five vessels damaged by suspected limpet mines, two sunk, including the Koala inside Ust-Luga. Increased activity on sabotage operations in the Baltic would therefore be expected over the next 12 months.
- Sanctioned designations on a shadow fleet tanker should play a key role in closing the doors. Designations should remove a tanker from Russia’s fleet; but it only works where the US, EU and UK jointly sanction a tanker. In March 2026, 111 of 623 designated tankers kept loading Russian cargo, pointing to political ineffectiveness. Furthermore, sanctioned vessels’ share of tanker-days doubled to 31% by April as idle ships returned to work. After 681 designations, Russian exports hit a record, so this policy isn’t working. However, Ukraine’s tanker strike campaign has worked commercially: one damaged vessel drove Turkey’s Besiktas Shipping out of Russian trade entirely, Black Sea insurance rates rose, and operators suspended sailings, leading to a persistent impact.
- Portsmouth was a notable event. On 27 July Zelensky met Britain’s new PM, Andy Burnham, aboard HMS Queen Elizabeth. The meeting was staged at Britain’s maritime defence development hub in Portsmouth, where the naval base sits alongside the maritime industrial and research estate. The announced package was drone projects and electronic warfare: British jamming to push Ukrainian drones through Russian interference, and licenses to mass-manufacture the Stone Cloak system. It coincided with Sea Breeze 2026-2; the largest mine warfare exercise Britain has hosted in a decade. This indicates Ukrainian cooperation on British maritime technology, covering uncrewed systems, electronic warfare, mine warfare. This could be a valuable new toolkit for the Ukrainian interdiction campaign to close the doors.
Rise of the machines: the man inside the droid
Entertainment has been faking robots for fifty years. It has just stopped faking.
In 1977 R2-D2 was a man. For every scene where the droid tilted, waddled and swore in electronic beeps, a three-foot-eight actor called Kenny Baker was folded inside a fibreglass shell, working the machine with his shoulders. Remote-controlled versions existed, but they were for rolling across a corridor. Whenever R2-D2 had to act, Kenny was in there. Every screen robot since has been a costume, a puppet, an animatronic on rails or a computer-generated image.
Until 2023, when Disney broke the rule book with AI. Its BDX droids, knee-high bipeds appeared in this year’s The Mandalorian & Grogu, they have nobody inside and nothing scripted. Their gait and gestures come from reinforcement learning, with hundreds of variants trained in simulation by a puppeteer. It is the first time an audience has met a character in which no performer is playing. Disney is not competing on technical precision, it is solving emotional legibility, how a machine with no face reads as delighted, wary or bored. This could be the binding constraint on the entire consumer end of robotics, and currently, almost nobody else is working on it.

Westworld asked the wrong question
The obvious reference is Westworld: a theme park of androids indistinguishable from people. Disney is now putting autonomous robots into a theme park, which makes the parallel irresistible, and largely wrong. Westworld’s anxiety was deception through realism. The problem that we’ve arrived at is the opposite. Nobody mistakes a BDX droid for a living thing, two feet tall, no face, visibly a machine, and people adore it anyway. Attachment does not require crossing the uncanny valley. It requires only that something appears to have intentions. Which is why the first serious law here is not about robots passing as human. In April China’s Cyberspace Administration, with four other agencies, issued rules in force from 15 July that prohibit engineering emotional dependence, ban manipulation designed to induce unreasonable decisions, and bar minors without verified parental consent. ByteDance and Alibaba withdrew personalised agents used by hundreds of millions within days. Note who wrote that, China builds 97% of the world’s humanoid robots and is the first state to legally restrain emotional attachment to them. In a country with an acute birth-rate problem, a convincing substitute for human company is a strategic risk to demographics, and no Western jurisdiction has anything comparable. For older adults, randomised trials show significant improvement in depression and loneliness, with a large effect for physically embodied robots. For children, the evidence is thin and uncomfortable, three to six-year-olds have been found to trust a robot over a human even when the robot is plainly wrong.
Meanwhile, the industry has gone live
 Behind the theme-park droids, the numbers this year for the broader robotics industry is revealing. Global humanoid shipments tripled in the first half of 2026, to 19,100 units, with the full year projected to be near 60,000 by Smart Analytics Global. That is clearly small fry against widespread adopted consumer durables like cars or phones. More than 70% went to industrial and commercial buyers, wanting marketing tools, reception robots, retail greeters and showroom units. Prices sit near $100,000 a unit and are forecast to fall to $25,000 a unit within three years. When you consider that the utilisation running cost is $3 to $8 an hour against $22 to $40 for human labour, payback can fall to six months. There is also a reason to build these machines that has nothing to do with the work they do. Large language models were trained on the internet, and the internet has been used up, researchers now speak of “peak data“. But the physical world has never been properly scraped. No amount of text teaches a machine to grasp a soft object or recover from a stumble. So a robotic fleet becomes a training corpus, and the company with the most machines in the most varied places accumulates a data asset rivals cannot buy. Arguably, China’s 97% first move share of the market is a deliberate move to enhance data collection advantages.
Rise of the machines: earth within the mind
Dendrons, dexterity and duration
A humanoid cannot wait on a data centre on the other side of the world to decide if it is falling over. A robot must think where it stands.
Chip designers have recognised this. Nvidia’s Jetson Thor delivers 2,070 teraflops inside 130 watts and is already adopted by Boston Dynamics, Amazon Robotics and FANUC; its fourteen processor cores are Arm’s. But the competition is over watts, not teraflops, because a humanoid runs on batteries. Israel’s Hailo runs a two-billion-parameter model in about 2.5 watts, against Thor’s 130 watts. Qualcomm has a robotics line of its own. And China is building the whole stack in parallel: Huawei’s Ascend already takes close to 60% of the domestic Chinese AI-chip market, and Horizon Robotics claims it will beat Nvidia’s best robotics part by 2027. Currently, on-device inference is a $25bn to $35bn market, and this is before humanoids have scaled at all.
The chip, though, is not the expensive part. Actuators are more than half of a humanoid’s bill of materials, and the dexterous hand alone, at 31% of total cost, is the costliest single component in the machine. Inside each actuator sits a harmonic drive: Japan’s Harmonic Drive Systems charges around $3,000 for a single 100 Nm unit, and a humanoid has forty joints. China’s Green Harmonic sells the equivalent at 40% to 60% of the Japanese price.
Bank of America puts the bill of materials for a humanoid built on Chinese supply chains at about $35,000, against $90,000 to $100,000 for Western pilot production. Build Tesla’s own Optimus Gen 2 without Chinese suppliers and the cost rises from roughly $46,000 to $131,000, three times as much.
Tesla’s response is to own every layer. It is converting Fremont into a line designed for a million Optimus robotic units a year and adding a 5.2m square foot Optimus plant at Giga Texas, on its own close to the size of the Pentagon. Then there is Terafab. The semiconductor works that SpaceX and Tesla are planning at Grimes, Texas, is designed at over 100 million square feet, five times the largest building on earth and roughly fifteen Pentagons. It will make the AI chips that run Optimus.
Chips, though, may be the part Texas can build but what about the rest? China mines 59% of the world’s magnet rare earths, refines 91% and makes 94% of the magnets. Substitutes exist, ferrite and alnico today, iron nitride and manganese-bismuth in the laboratory, but everyone trades away torque density, the single thing a robot joint cannot spare.
The West is building an answer. MP Materials is heading for 10,000 tonnes of magnets a year, and Lynas is the only producer outside China separating the heavy rare earths at commercial scale, though MP’s second plant does not commission until 2028. At 3.5 to 4kg of magnets a robot, MP’s eventual output would supply some 2.5 million humanoids a year. This sounds impressive until you remember the same magnets are wanted by electric vehicles, wind turbines, defence and consumer electronics. Nobody is building magnet capacity dedicated to robots.
Which brings us to the knotty problem of Greenland, and the limits of a mine. Greenland holds one of the world’s great heavy rare earth endowments outside of China and produces none of it. Even if the Greenland Tanbreez pilot mine delivers, it does not solve a refining problem, and refining is where 91% of China’s grip actually lies.
Market size
The honest answer is that no one knows. Goldman Sachs implies 42% annual growth from here and Bank of America 88%, which is a gap that compounds to a factor of thirty over a decade, from a base of 60,000 units this year against 18,000 last. When you consider that Morgan Stanley puts the market at $5trn by 2050 with a billion robots in service, these institutions are not really forecasting a market size so much as asserting that a market will exist where today there is none.

Market assumption approach
 Approach
The principle is to consider typical eight-year returns based on where we are in the economic cycle.
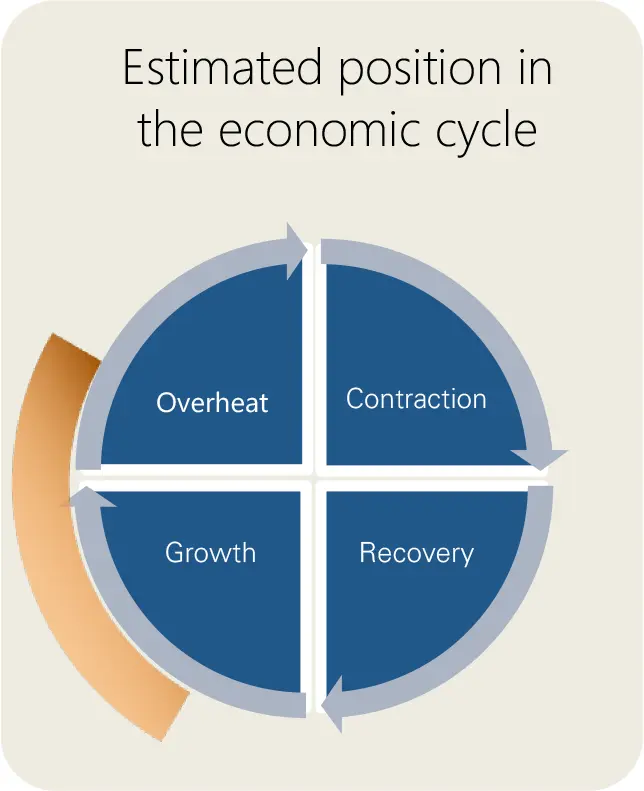
A classical view of the economic cycle is that the economy moves through four stages, growth; economic overheat, requiring intervention from central banks to temper inflation; contraction requiring economic stimulus to get the economy back on its feet; and then recovery as stimulus is scaled back. In real-life the economy can move backwards or skip a stage compared to this simplified representation.
Market returns can also be impacted by events that fall outside of this cyclical macro-economic behaviour.
Covid-19 was one such example which led to the global economy cycling very quickly through contraction and back into overheat.
Whilst stock market crashes are possible at all stages of the economic cycle, they are more likely to be deeper and felt wider across the economy when the cycle moves from overheat into contraction.
Position in the economic cycle
Global activity remains expansionary, but growth is muted and uneven, and labour-market momentum is softening. Disinflation has stalled, driven more by energy, trade and capacity constraints than by broad excess demand, with renewed geopolitical tension adding to oil-price pressure. Strong earnings and AI-related investment continue to support markets, although performance is becoming more selective as investors focus increasingly on realised returns. Central banks are therefore keeping policy restrictive and, in some cases, raising rates, limiting their ability to support still-muted growth. The cycle remains predominantly in Growth, with a smaller Overheat component reflecting renewed price pressure, restrictive policy and elevated market confidence rather than universally excessive demand.
We have weighted our analysis as 75% Growth, 25% Overheat.
Estimating returns
The return for cash is the SONIA overnight rate for cash expressed as an annualised return.
For assets in the Fixed Income asset classes, we used the latest eight-year yield to maturity as the annualised return for each of the sub-asset classes. This is to avoid any arbitrage opportunities within the market return estimates.
For Equities and remaining asset classes, our market data from 1971 is partitioned into four economic stages – Growth, Overheat, Contraction and Recovery. Then we have calculated annualised risk and return for each index over rolling two-year and eight-year periods. The analysis is done net of UK inflation. We have then added back in current expectations of eight-year UK inflation to give a return expectation based on current inflation expectations and a probabilistic weighting of where we are in the economic cycle.
Manual adjustments to reflect efficient market pricing
Some risky asset classes do not fit on a neat risk return spectrum, such as the FTSE All-Share AIM historical risk, and Emerging Markets historical returns. For example, FTSE AIM exhibits moderate volatility and very poor historical downside events. Conversely, Emerging Markets has high volatility but low historical returns. For parity, we adjusted FTSE AIM risk upwards in line with observed downside performance. The Emerging Market equity returns were adjusted upwards to be in line with a capital asset pricing model (CAPM), in essence this means that an investor would expect to be compensated with more return for taking on more risk in Emerging Market equities.
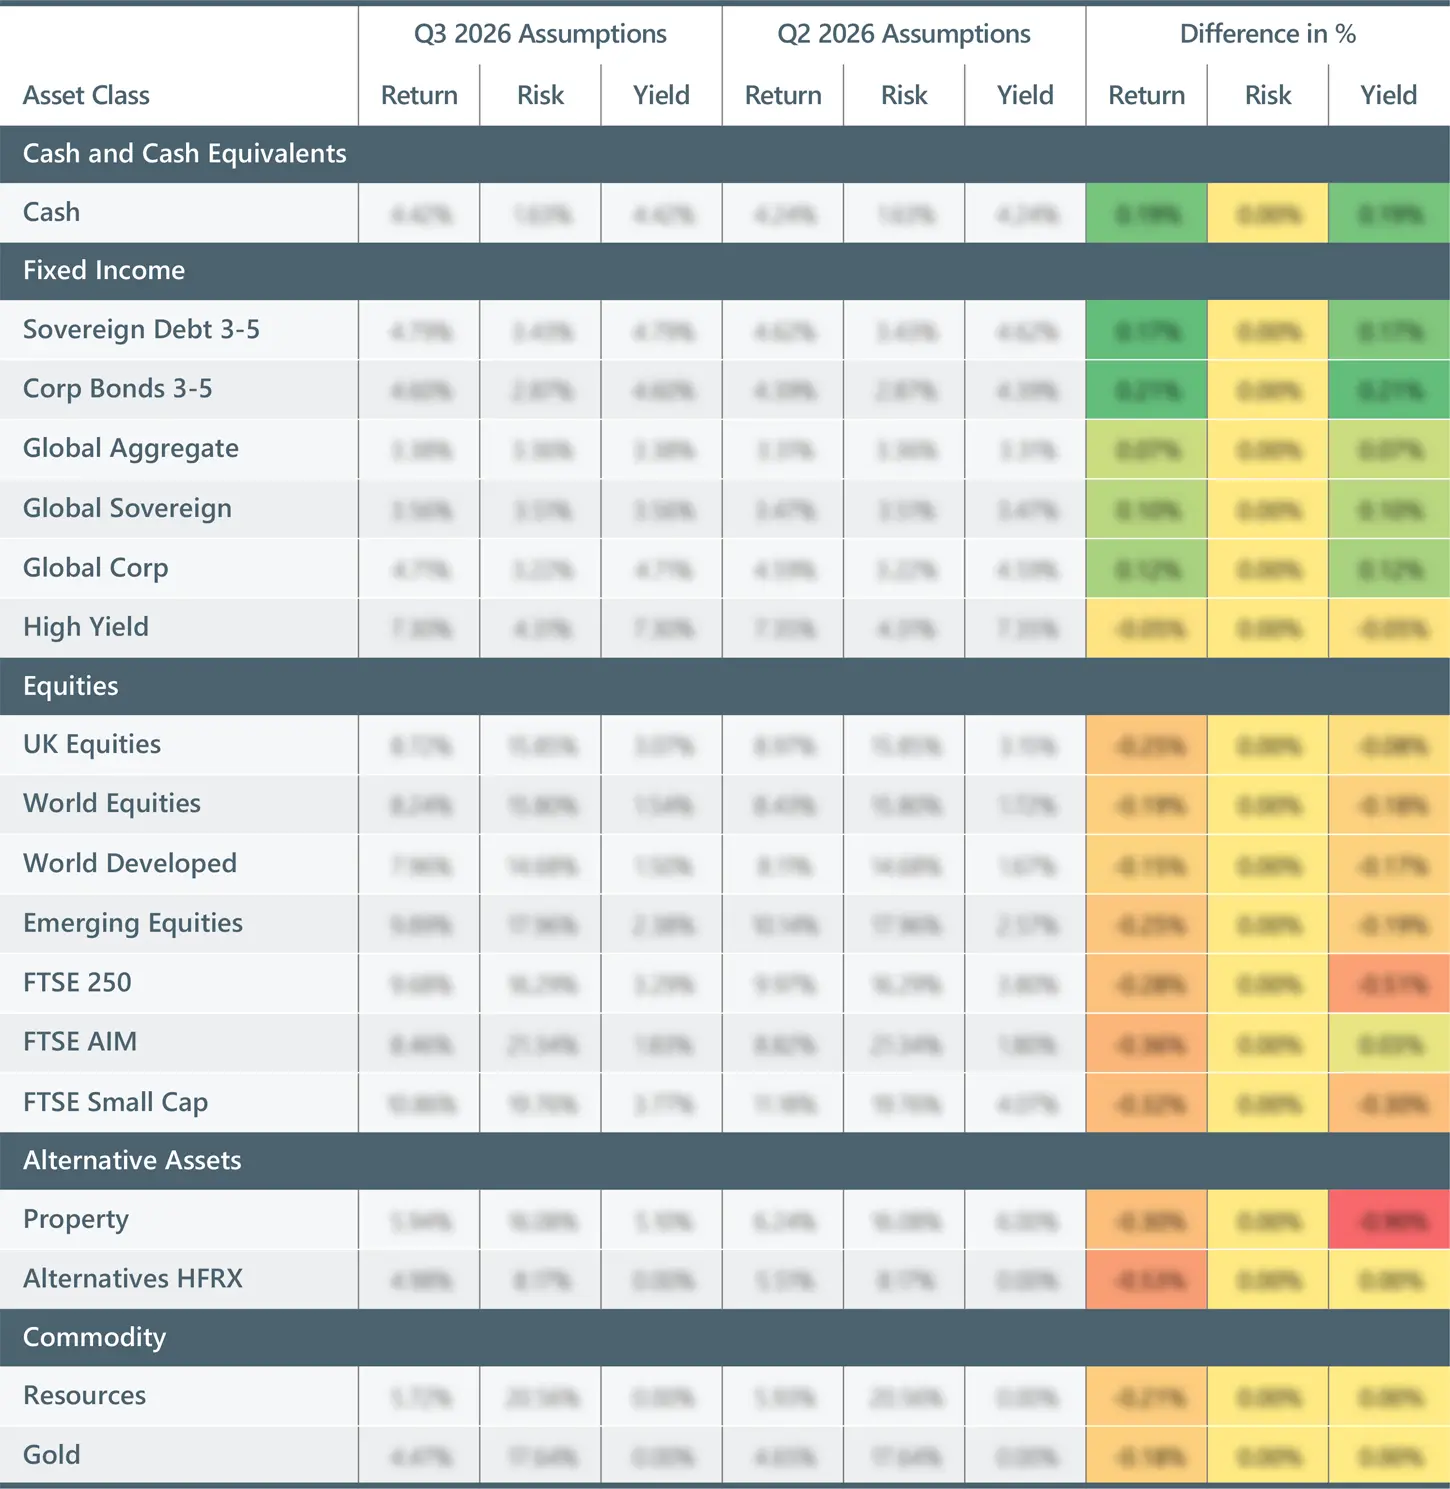
Asset class assumptions
Notes on returns and risks given in the table below
Calculation date: 16 July 2026
Assumptions: Nominal returns and risks
Risk horizon: 2 years
Return horizon: 8 years
Yield: Prevailing market rates as at calculation date
Inflation basis: UK market rates from the Bank of England at calculation date
Cycle basis: 75% Growth, 25% Overheat
Further information
For further information on this document please contact

Managing Director
Dorey Financial Modelling
Office 1, Floor 4
2 Cornet Street
St Peter Port
Guernsey GY1 1BZ
Email: martyn.dorey@doreyltd.com
Direct: 01481 740560
Office: 01481 729044
Mobile: 07839 700717
Web: www.doreyltd.com

Associate Actuary
Dorey Financial Modelling
Unit 1
The Courtyard
Sturton Street
Cambridge, CB1 2SN
Email: Robert.Whitfield@doreyltd.com
Direct: 01481 740568
Office: 01481 729044
Mobile: 07792 851064
Web: www.doreyltd.com

Consultant
Dorey Financial Modelling
Office 1, Floor 4
2 Cornet Street
St Peter Port
Guernsey GY1 1BZ
Email: Bernadette.kerr@doreyltd.com
Office: 01481 729044
Web: www.doreyltd.com
Important notice
This document has been produced by Dorey Limited, trading as Dorey Financial Modelling. Dorey Financial Modelling does not give advice as to the purchase, sale, subscription for or underwriting of investments, or advice as to the exercise of rights conferred by investments. Dorey Financial Modelling does not perform any delegated investment functions across any of its clients.
Dorey Financial Modelling is not authorised and/or regulated in the United Kingdom by the Financial Conduct Authority (“FCA”) under the Financial Services and Markets Act 2000 or in the Island of Guernsey by the Guernsey Financial Services Commission (“GFSC”). Recipients should also note that they will not be able to bring any complaints about Dorey Financial Modelling to the FCA, the Financial Ombudsman Service or the GFSC or claim compensation from the Financial Services Compensation Scheme.
Certain countries and jurisdictions have restrictions imposed by law on the distribution of information, accordingly, the information that may be viewed is not directed at or intended to be acted upon by anyone in any jurisdiction where it would be unlawful to do so or in which Dorey Financial Modelling would be required to be authorised. It is the responsibility of the recipients to acquaint themselves with and to comply with the laws and regulations that apply to them.
No information given in this document constitutes a solicitation, offer or recommendation by anyone in any jurisdiction to provide any investment advice or services. Recipients confirm that they are eligible to view its content. If any Recipient is not eligible, they should not proceed to read this report. The information contained in this report, which does not purport to be comprehensive, has been compiled by Dorey Financial Modelling. References to specific companies or securities are illustrative of the themes discussed and are not recommendations to buy, sell or hold. Dorey Financial Modelling, its officers and employees may hold positions in, or have commercial relationships with, companies referred to in this document. No enquiry has been made of individual holdings, and no representation is given as to whether any such position exists.
While this information has been compiled in good faith, no representation or warranty, express or implied, is or will be made and no responsibility or liability is or will be accepted by Dorey Financial Modelling, or by any of its respective officers, employees or agents, in relation to the accuracy or completeness of the document or any other written or oral information made available to any interested party, or its advisers and any such liability is expressly disclaimed. In particular, but without prejudice to the generality of the foregoing, no representation or warranty is given as to the achievement or reasonableness of any future projections, estimates or prospects contained in the document or in such other written or oral information.
This document has been compiled and published by Dorey Financial Modelling. To the fullest extent legally permissible, no reproduction, copying, image scanning, storing, recording or (except as required by law) or modifying of the report by any means in any form nor broadcasting or transmission through any medium of any part of the report is permitted without Dorey Financial Modelling’s prior express written consent. All intellectual property rights that belong to Dorey Financial Modelling in respect of the Modelling work supporting this document are reserved.
These Terms are governed by and construed in accordance with the laws of the Island of Guernsey and Dorey Financial Modelling and all recipients hereby submit to the non-exclusive jurisdiction of the Courts of the Island of Guernsey.
By viewing this document, recipients agree to be bound by the foregoing Terms.
